Red food coloring (M)=1.08E-06
x=dye concentration, y= absorbance
Treadline equation: y = 2E+06x - 0.1895
R² = 0.9694
Use the trendline for the wavelength with the highest absorbance values in your graph above to answer this question (i.e., the uppermost trendline in your graph). If a solution of food coloring of unknown concentration is found to have an absorbance of 0.325 at that wavelength, calculate the concentration of food coloring in the solution.


Related textbook solutions

Basic Chemistry

Principles of Chemistry Molecular Approach

Principles of Chemistry Molecular Approach

Chemistry: Structure and Properties

Chemistry: A Molecular Approach

Chemistry: A Molecular Approach

Principles of Chemistry: A Molecular Approach

Chemistry: The Central Science
Related questions
Just need help answering the ***** question under conclusions. here is my worksheet with information
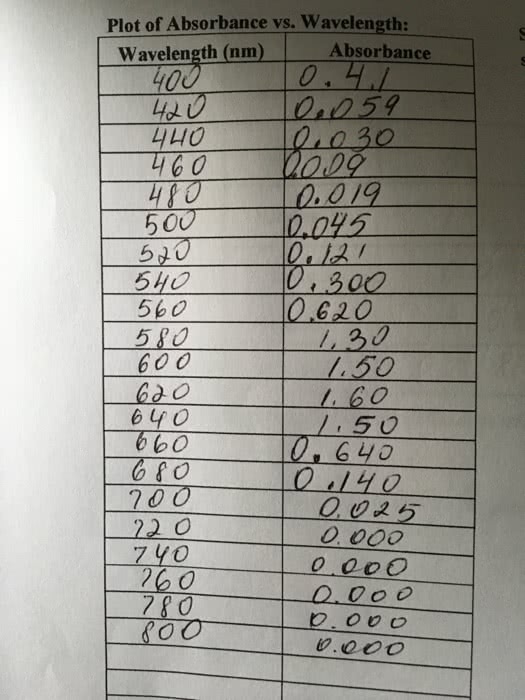
Record your absorbance measurements for the copper (II) sulfate solution in the table below.
| Wavelength (nm) | Absorbance |
| 400 | 0.00 nm |
| 420 | 0.00 nm |
| 440 | 0.00 nm |
| 460 | 0.00 nm |
| 480 | 0.00 nm |
| 500 | 0.00 nm |
| 520 | 0.00 nm |
| 540 | 0.00 nm |
| 560 | 0.02 nm |
| 580 | 0.05 nm |
| 600 | 0.09 nm |
| 620 | 0.14 nm |
| 640 | 0.22 nm |
| 660 | 0.35 nm |
| 680 | 0.50 nm |
| 700 | 0.63 nm |
Record your absorbance measurements for the cobalt (II) chloride solution in the table below.
| Wavelength (nm) | Absorbance |
| 400 | 0.00 nm |
| 420 | 0.1 nm |
| 440 | 0.07 nm |
| 460 | 0.07 nm |
| 480 | 0.16 nm |
| 500 | 0.23 nm |
| 520 | 0.22 nm |
| 540 | 0.13 nm |
| 560 | 0.07 nm |
| 580 | 0.04 nm |
| 600 | 0.00 nm |
| 620 | 0.00 nm |
| 640 | 0.00 nm |
| 660 | 0.00 nm |
| 680 | 0.00 nm |
| 700 | 0.00 nm |
Data Analysis
Create and save a graph of absorbance (y-axis) versus the wavelength (x-axis) for both copper (II) sulfate and cobalt (II) chloride. Click the graphing icon below to create your graph. 

Experiment 2: Measure Absorbance versus Concentration for Cu+2 Ions
Lab Results
What wavelength did you use to measure the absorbance of the copper (II) sulfate solutions?
| 700 nm |
Data Analysis
Create and save a graph of absorbance (y-axis) versus the concentration of the copper (II) sulfate solutions (x-axis). Click the graphing icon below to create your graph. 
The y-intercept of the plot of absorbance versus concentration is approximately 0. Why is this?
| It should be a straight line obtained by having a slope of = 1 and y-intercept = 0. |
Experiment 3: Determine the Cu+2 Concentration in Unknown Solutions of Copper (II) Sulfate
Lab Results
How many mL of the unknown solutions did you use for your absorbance measurements?
| 10 mL |
Data Analysis
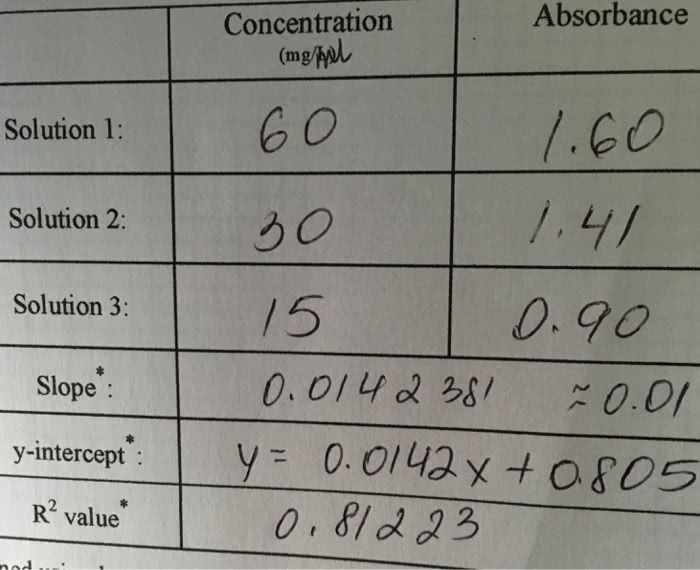
Determine the copper (II) sulfate concentrations in your two unknown samples from the calibration plot.
| wavelength used: 700 nm absorbance unknown: a. 0.08 b. 0.12 |
Conclusions
*******Were the unknown solutions more or less concentrated than the copper (II) sulfate solution used in experiment 1?
Given the data in the table below, what is the concentration of the unknown solution? Both solutions contain the same substance.
| standard solution concentration | 1.25 M |
| standard solution absorbance | 0.75 |
| unknown solution absorbance | 0.38 |
| 0.63 M is the concentration of the unknown solution. |