Just need help answering the ***** question under conclusions. here is my worksheet with information
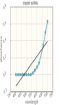
Record your absorbance measurements for the copper (II) sulfate solution in the table below.
Wavelength (nm)
Absorbance
400
0.00 nm
420
0.00 nm
440
0.00 nm
460
0.00 nm
480
0.00 nm
500
0.00 nm
520
0.00 nm
540
0.00 nm
560
0.02 nm
580
0.05 nm
600
0.09 nm
620
0.14 nm
640
0.22 nm
660
0.35 nm
680
0.50 nm
700
0.63 nm
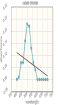
Record your absorbance measurements for the cobalt (II) chloride solution in the table below.
Wavelength (nm)
Absorbance
400
0.00 nm
420
0.1 nm
440
0.07 nm
460
0.07 nm
480
0.16 nm
500
0.23 nm
520
0.22 nm
540
0.13 nm
560
0.07 nm
580
0.04 nm
600
0.00 nm
620
0.00 nm
640
0.00 nm
660
0.00 nm
680
0.00 nm
700
0.00 nm
Data Analysis
Create and save a graph of absorbance (y-axis) versus the wavelength (x-axis) for both copper (II) sulfate and cobalt (II) chloride. Click the graphing icon below to create your graph.
Experiment 2: Measure Absorbance versus Concentration for Cu+2 Ions
Lab Results
What wavelength did you use to measure the absorbance of the copper (II) sulfate solutions?
700 nm
Data Analysis
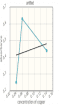
Create and save a graph of absorbance (y-axis) versus the concentration of the copper (II) sulfate solutions (x-axis). Click the graphing icon below to create your graph. Click the box underneath the graph to show the trendline. It will automatically calculate your slope and intercept.
The y-intercept of the plot of absorbance versus concentration is approximately 0. Why is this?
It should be a straight line obtained by having a slope of = 1 and y-intercept = 0.
Experiment 3: Determine the Cu+2 Concentration in Unknown Solutions of Copper (II) Sulfate
Lab Results
How many mL of the unknown solutions did you use for your absorbance measurements?
10 mL
Data Analysis
Determine the copper (II) sulfate concentrations in your two unknown samples from the calibration plot.
wavelength used: 700 nm
absorbance unknown: a. 0.08 b. 0.12
Conclusions
*******Were the unknown solutions more or less concentrated than the copper (II) sulfate solution used in experiment 1?
Given the data in the table below, what is the concentration of the unknown solution? Both solutions contain the same substance.
standard solution concentration
1.25 M
standard solution absorbance
0.75
unknown solution absorbance
0.38
0.63 M is the concentration of the unknown solution.