Verified Documents at University of British Columbia
- Application of Statistics in Business
- University of British Columbia
- Verified Notes
Browse the full collection of course materials, past exams, study guides and class notes for COMM 291 - Application of Statistics in Business at University of British Columbia …
PROFESSORS
All Professors
All semesters
Jonathan Berkowitz
winter
16Verified Documents for Jonathan Berkowitz
Class Notes
Taken by our most diligent verified note takers in class covering the entire semester.
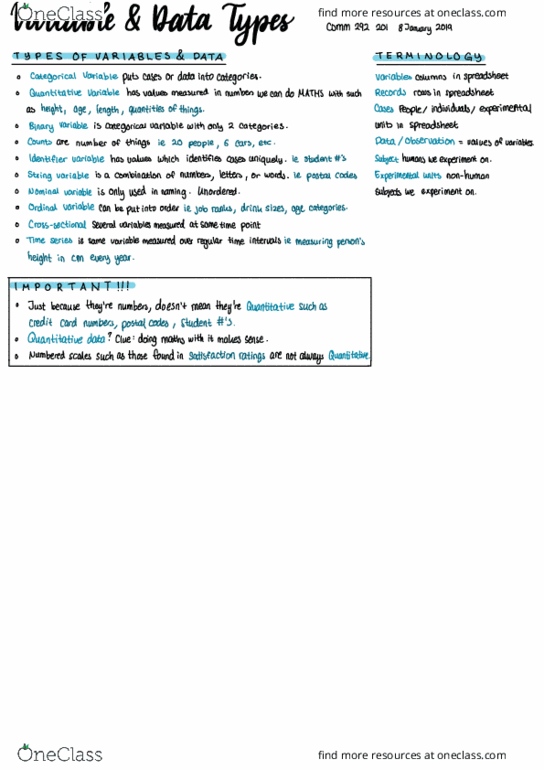
COMM 291 Lecture 2: COMM 291 201 - Lecture 2 - Variables and Data Types
Variable puts cases or data into categories . variables columns in spreadsheet. Variable has values measured in numbers we can do maths with such. Reco
1117
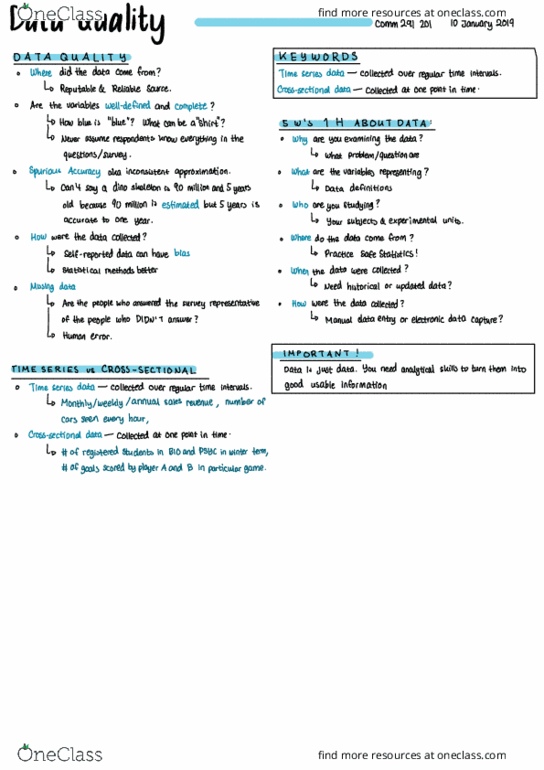
COMM 291 Lecture Notes - Lecture 3: Missing Data
Time series data collected over regular time intervals. Cross-sectional data collected at one point in time is blue " Never assume respondents know eve
176
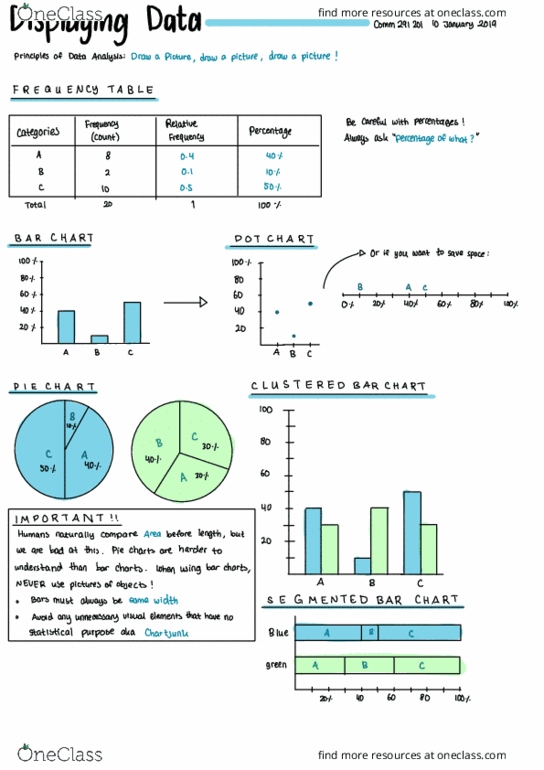
COMM 291 Lecture 3: COMM 291 201 - Lecture 3 - Displaying data
197
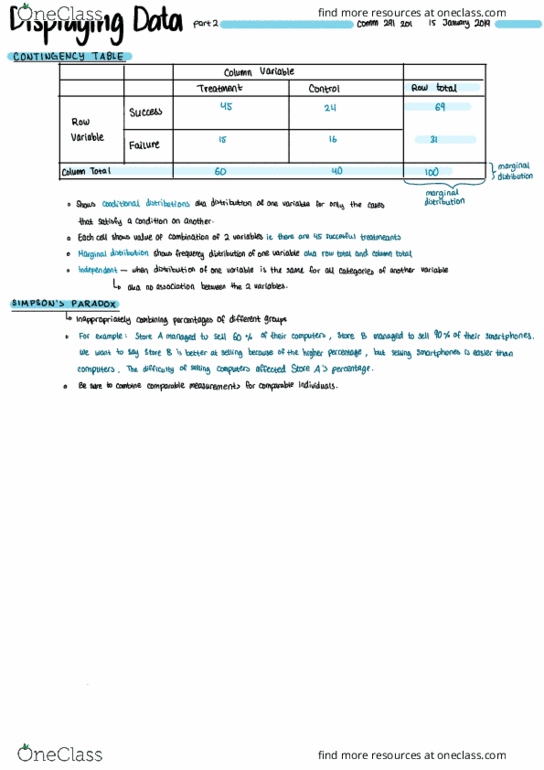
COMM 291 Lecture Notes - Lecture 4: Marginal Distribution, Frequency Distribution
Inf marginal distribution: shows conditional distributions aka distribution of one variable for only the cases that satisfy a condition on another o. 4
175
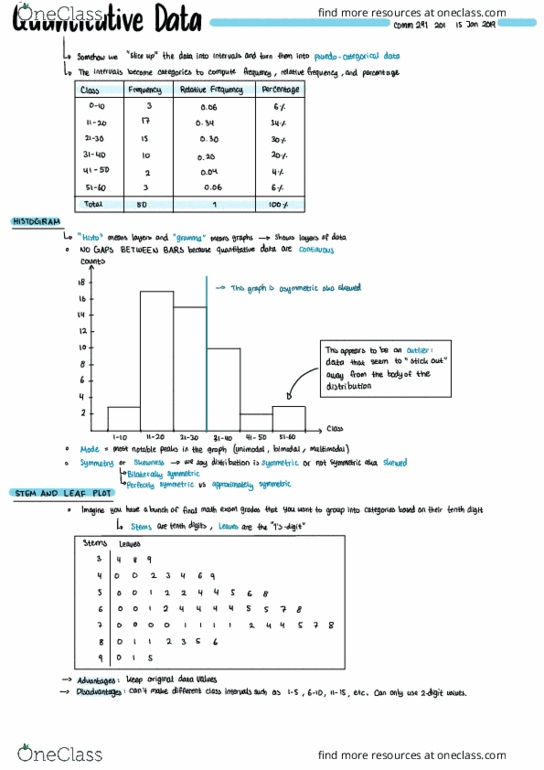
COMM 291 Lecture Notes - Lecture 4: Categorical Variable, Skewness, Unimodality
Somehow we slice up the data into intervals and turn them into puedo - categorical data. The intervals become categories to compute frequency , relativ
272
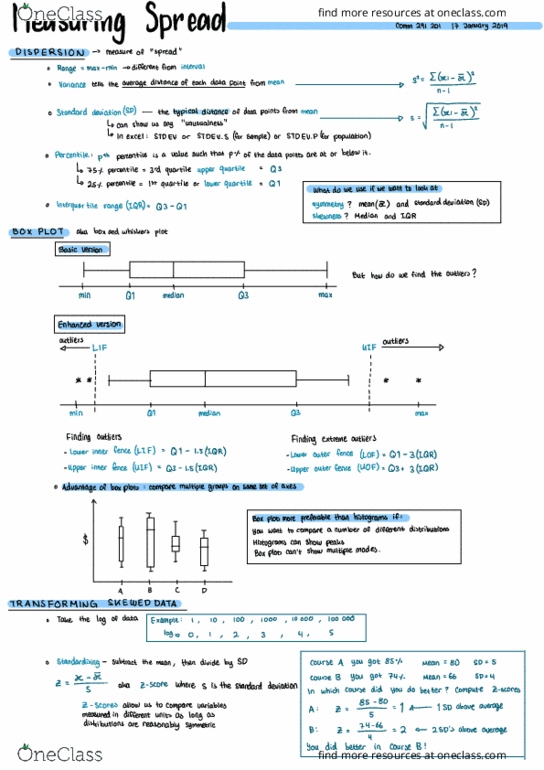
COMM 291 Lecture 5: COMM 291 201 - Lecture 5 - Measuring Spread
M f a sun ing spr f ctd. Standard deviation (sd ) the typical data point from mean. : pth percentile is a value such that pot of the data points are at
178

COMM 291 Lecture Notes - Lecture 6: Scatter Plot, Standard Deviation, If And Only If
140
COMM 291 Lecture Notes - Lecture 6: Scatter Plot, Standard Deviation
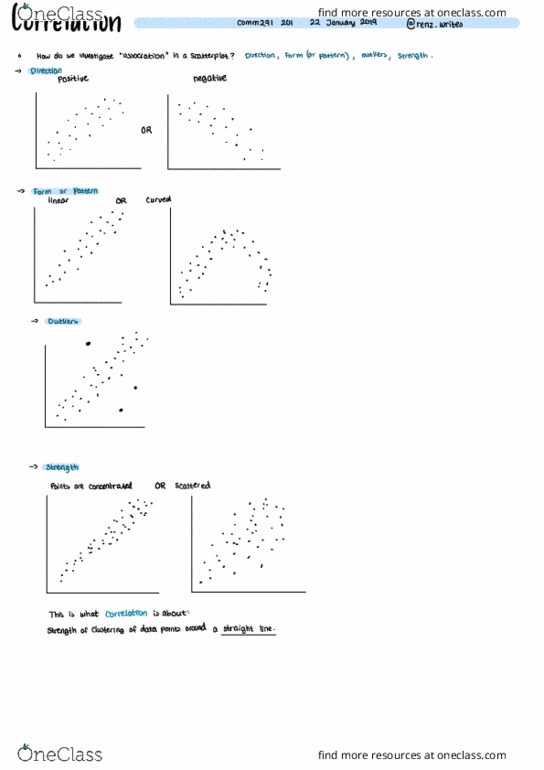
How do we investigate association in a scatter plot. This is what correlation is about strength of clustering of data points around a straight line . a
274
COMM 291 Lecture 7: COMM 291 201 - Regression
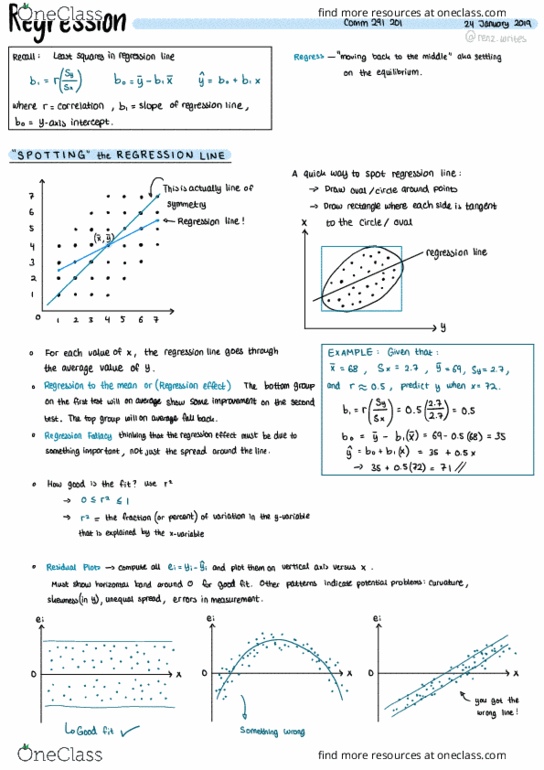
Regress moving back to the middle aka settling bi. + b , where r correlation bo y - axis intercept slope of regression line. D ooo so so is actually li
158
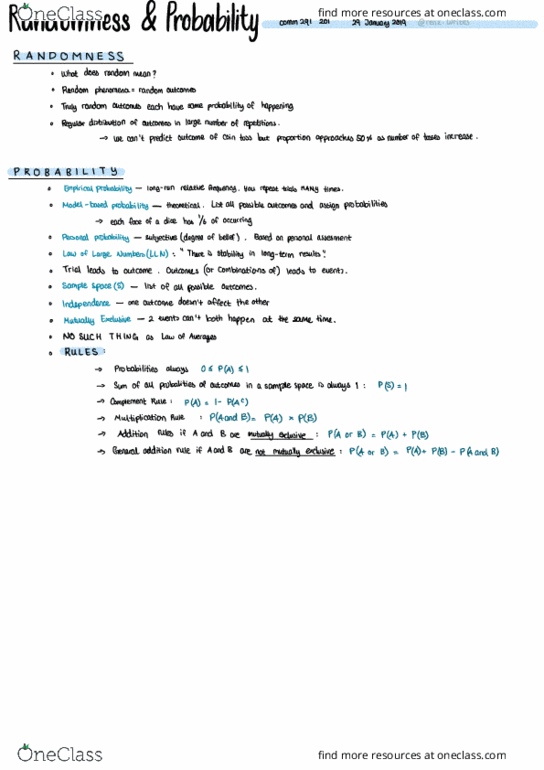
COMM 291 Lecture 8: COMM 291 201 - Randomness - probability
R a n d o m n e ss o what does random mean. Truly random outcomes each have same probability of happening. Regular distribution of outcomes in large nu
166
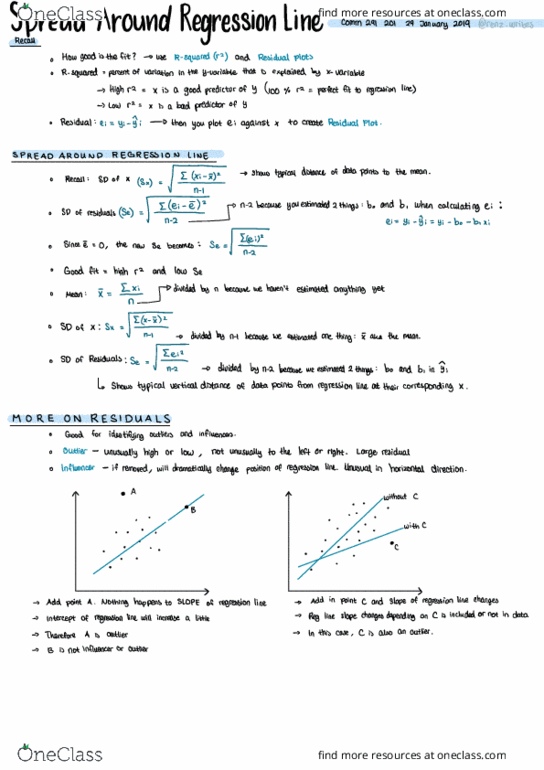
COMM 291 Lecture 8: COMM 291 201 - spread around the regression line
How good is the fit ? a use. R - squared = percent of variation in the y - variable that. High r2 x is a good predictor of y. 400% ra i perfect fit to
1129
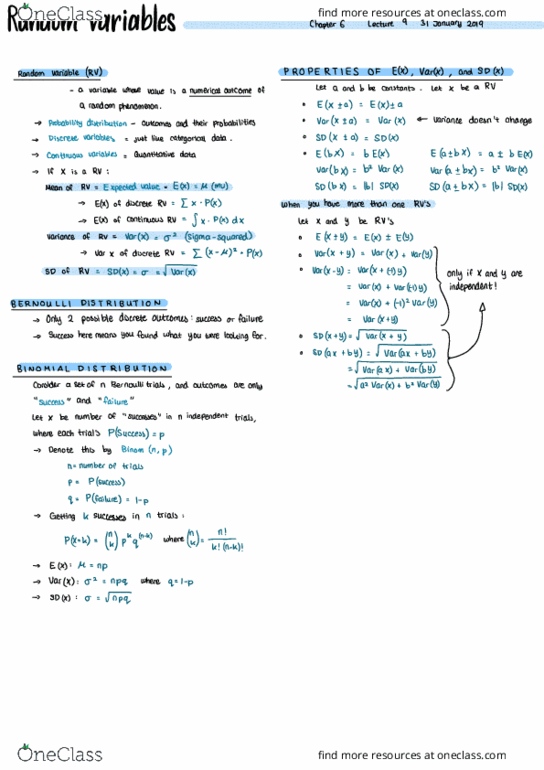
COMM 291 Lecture Notes - Lecture 9: Random Variable, Bernoulli Distribution, Probability Distribution
I only if x and y are t t var. 2 possible discrete guys here mean you found. Let be number of successes where each trial. Binom ( n n - number of trial
181
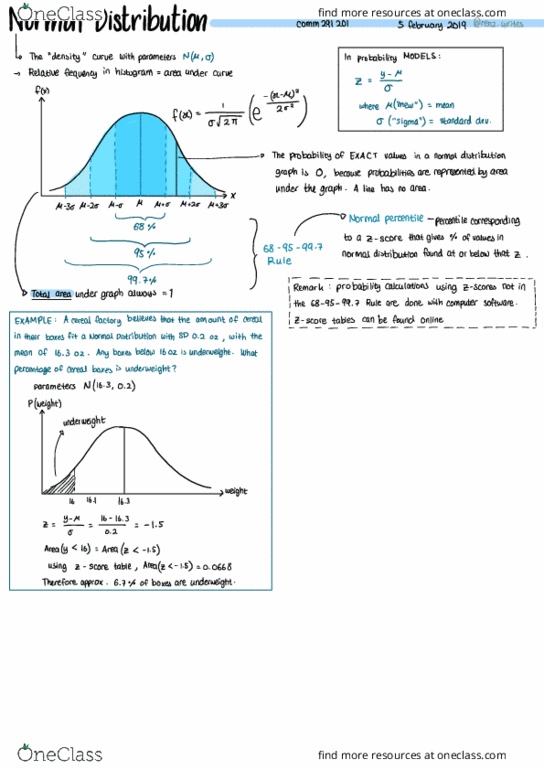
COMM 291 Lecture 10: COMM 291 201 - Lecture 10 - Normal distribution
291

COMM 291 Lecture 11: COMM 291 201 - Lecture 11 - Sampling and surveys
Where do data come from ? voluntary surveys leg. Internet usually worthless experimental studies actively manipulate variables observational studies se
160
COMM 291 Lecture 11: COMM 291 201 - Lecture 11 - Normal distribution and sampling
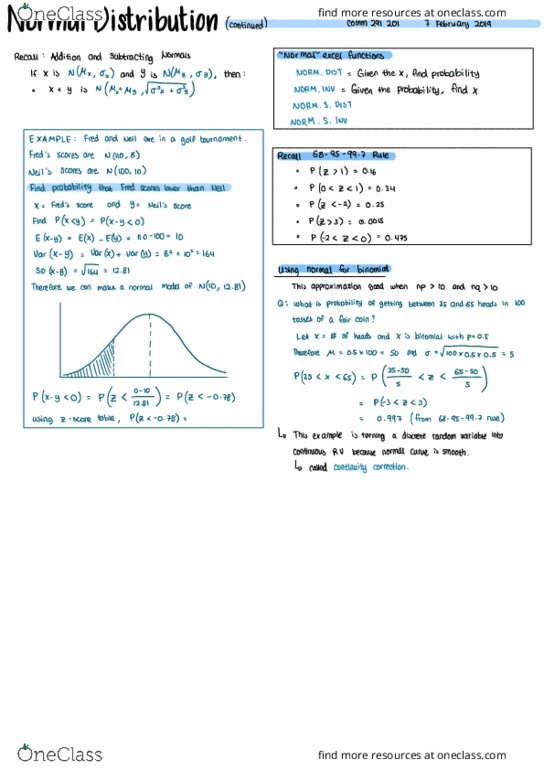
Pfxsy ) p ( x - y co. This approximation good when np to and nq > to p ( x . y so ) plzc. Q : what is probability of getting between. This example i
2107

COMM 291 Lecture 11: COMM 291 201 - Lecture 11 - Normal distribution (continued)
174