COMM 291 Lecture 5: COMM 291 201 - Lecture 5 - Measuring Spread

COMM 291 verified notes
5/11View all
Document Summary
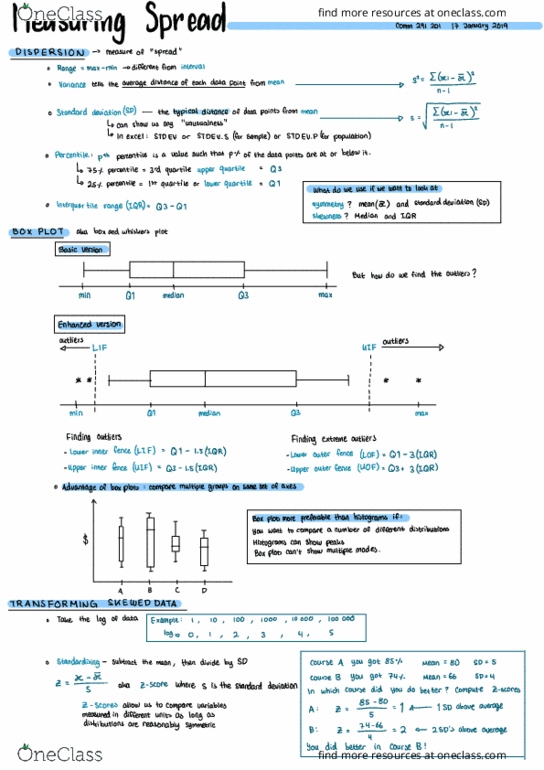
M f a sun ing spr f ctd. Standard deviation (sd ) the typical data point from mean. : pth percentile is a value such that pot of the data points are at or below it. Q2 lnterquar tile range ( iqr ) - Version what do we use if we want to look at symmetry mean ( e ) and skewness. Advantage of box plots : compare multiple groups on same set of axes. Box plots more preferable than histograms if you want to compare a number of different distributions. 5: standardising - subtract the mean then divide. Z - score where s is the standard deviation. Z - scores allow us measured in different to compare units as variables long as distributions are reasonably symmetric course b.