COMM 291 Lecture 8: COMM 291 201 - spread around the regression line

COMM 291 verified notes
8/11View all
Document Summary
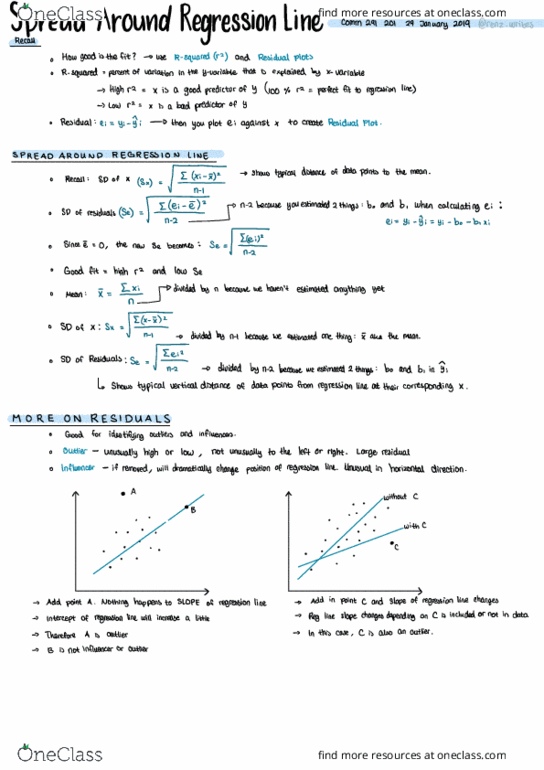
How good is the fit ? a use. R - squared = percent of variation in the y - variable that. High r2 x is a good predictor of y. 400% ra i perfect fit to regression line ) Low r2 x is a bad predictor of. Ii a then you plot ei against x to create. X ( sx ) shows typical distance of data points to the mean. , when calculating e ; and n n - i haven"t mean. Since e - anything estimated because we divided by divided by. =e(e divided by n -2 because we estimated 2 things : will dramatically change from regression unusually high corresponding line . kknusual. M o r e because we influencers . regression bro and horizontal typical right direction. C or low line at their of data residual outliers and. Intercept of regression line will increase a little. Add in point c and slope of regression line changes.