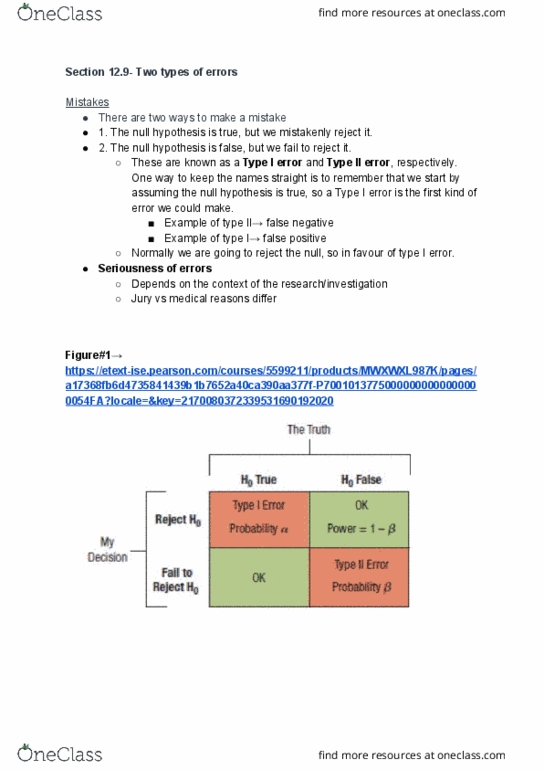
1 Which of the following statements about Type I and Type II errors is correct a Type I: Reject a true alternative hypothesis. Type II: Do not reject a false alternative. b Type I: Reject a true null hypothesis. Type II: Do not reject a false null hypothesis. c Type I: Reject a false null hypothesis. Type II: Reject a true null hypothesis. d Type I: Do not reject a false null hypothesis. Type II: Reject a true null hypothesis. 2 You are reading a report that contains a hypothesis test you are interested in. The writer of the report writes that the p-value for the test you are interested in is 0.0749, but does not tell you the value of the test statistic. From this information you can: a Not reject the hypothesis at a Probability of Type I error = .05, but reject the hypothesis at a Probability of Type I error = 0.10 b Reject the hypothesis at a Probability of Type I error = .05, and reject at a Probability of Type I error = 0.10 c Not reject the hypothesis at a Probability of Type I error = 0.05, and not reject at a Probability of Type I error = 0.10 d Reject the hypothesis at a Probability of Type I error = .05, but not reject at a Probability of Type I error = 0.10 3 The random sample below is obtained to test the following hypothesis about the population mean. H?: ? ? 1500 H?: ? > 1500 620 1711 366 2528 2678 1661 442 725 1938 409 330 2480 542 369 2124 549 2074 1665 1873 873 2143 2061 1177 2509 1264 2397 1523 1837 1958 1041 1639 2199 2232 387 2270 2136 1111 1883 2612 2230 1597 1726 694 1990 1354 2090 909 2128 1608 747 1121 2220 2390 2347 1041 316 655 632 2064 1901 532 552 846 2704 1410 2165 1065 937 1452 2539 410 656 1169 527 809 2364 2350 2210 1459 2391 856 2711 1985 2382 2289 1927 518 2177 437 1151 2018 1580 607 2715 2188 1691 1394 2610 1186 695 2428 2246 858 2036 1681 2449 1578 1971 1846 1729 2389 1737 1913 1863 2072 2593 2287 2220 2230 551 458 2626 2731 488 2551 1736 1373 307 1803 2647 2679 1508 1468 1443 516 1002 2116 2616 817 2522 460 1879 1999 1837 The level of significance of the test is ? = 0.05. Compute the relevant test statistic. This is a(n) _______ (two-tail, upper-tail, lower-tail) test. The test statistic is TS = _______. a Two-tail test TS = 1.81 Do not reject H?: ? ? 1500. Conclude that the population mean is not greater than 1500. b Upper tail test. TS = 1.52 Do not reject H?: ? ? 1500. Conclude that the population mean is not greater than 1500. c Upper tail test. TS = 1.81 Reject H?: ? ? 1500. Conclude that the population mean is greater than 1500. d Lower tail test. TS = 1.98 Do not reject H?: ? ? 1500. Conclude that the population mean is no greater than 1500. 4 Consider the following hypothesis test. H?: ? ? 30 H?: ? > 30 A random sample of n = 15 yielded the following observations 51 38 26 16 28 57 20 33 35 23 21 47 56 54 36 Use ? = 0.05 TS = ______ CV = ______ State the decision rule. a 1.68 1.761 Do not reject H?. Conclude the mean is not greater than 30. b 1.68 1.64 Reject H?. Conclude the mean is greater than 30. c 1.847 2.145 Do not reject H?. Conclude the mean is not less than 30. d 1.847 1.761 Reject H?. Conclude the mean is less than 30. 5 In a recent study, a major fast food restaurant had a mean service time of 165 seconds. The company embarks on a quality improvement effort to reduce the service time and has developed improvements to the service process. The new process will be tested in a sample of stores. The new process will be adopted in all of its stores, if it reduced mean service time by more than 45 seconds compared to the current mean service time. To perform the hypothesis test, the sample of 48 stores yields the following data (seconds). 90 96 133 108 136 110 119 138 129 98 101 92 135 124 115 90 132 125 110 124 126 138 94 130 108 96 140 135 102 114 109 137 138 104 108 134 92 107 96 119 105 111 96 136 126 116 98 131 Use ? = 0.05 |TS| = ______ |CV| = ______ a 1.548 1.678 Do not reject H?. The mean service time is not reduced by more than 45 seconds. Do not adopt the new process. b 1.871 1.678 Reject H?. The mean service time is reduced by more than 45 seconds. Adopt the new process. c 1.871 1.640 Do not reject H?. The mean service time is not reduced by more than 45 seconds. Do not adopt the new process. d 1.548 1.640 Reject H?. The mean service time is reduced by more than 45 seconds. Adopt the new process.
| 1 | Which of the following statements about Type I and Type II errors is correct | ||||||||
| a | Type I: Reject a true alternative hypothesis. Type II: Do not reject a false alternative. | ||||||||
| b | Type I: Reject a true null hypothesis. Type II: Do not reject a false null hypothesis. | ||||||||
| c | Type I: Reject a false null hypothesis. Type II: Reject a true null hypothesis. | ||||||||
| d | Type I: Do not reject a false null hypothesis. Type II: Reject a true null hypothesis. | ||||||||
| 2 | You are reading a report that contains a hypothesis test you are interested in. The writer of the report writes that the p-value for the test you are interested in is 0.0749, but does not tell you the value of the test statistic. From this information you can: | ||||||||
| a | Not reject the hypothesis at a Probability of Type I error = .05, but reject the hypothesis at a Probability of Type I error = 0.10 | ||||||||
| b | Reject the hypothesis at a Probability of Type I error = .05, and reject at a Probability of Type I error = 0.10 | ||||||||
| c | Not reject the hypothesis at a Probability of Type I error = 0.05, and not reject at a Probability of Type I error = 0.10 | ||||||||
| d | Reject the hypothesis at a Probability of Type I error = .05, but not reject at a Probability of Type I error = 0.10 | ||||||||
| 3 | The random sample below is obtained to test the following hypothesis about the population mean. | ||||||||
| H?: ? ? | 1500 | ||||||||
| H?: ? > | 1500 | ||||||||
| 620 | 1711 | 366 | 2528 | 2678 | 1661 | 442 | 725 | 1938 | |
| 409 | 330 | 2480 | 542 | 369 | 2124 | 549 | 2074 | 1665 | |
| 1873 | 873 | 2143 | 2061 | 1177 | 2509 | 1264 | 2397 | 1523 | |
| 1837 | 1958 | 1041 | 1639 | 2199 | 2232 | 387 | 2270 | 2136 | |
| 1111 | 1883 | 2612 | 2230 | 1597 | 1726 | 694 | 1990 | 1354 | |
| 2090 | 909 | 2128 | 1608 | 747 | 1121 | 2220 | 2390 | 2347 | |
| 1041 | 316 | 655 | 632 | 2064 | 1901 | 532 | 552 | 846 | |
| 2704 | 1410 | 2165 | 1065 | 937 | 1452 | 2539 | 410 | 656 | |
| 1169 | 527 | 809 | 2364 | 2350 | 2210 | 1459 | 2391 | 856 | |
| 2711 | 1985 | 2382 | 2289 | 1927 | 518 | 2177 | 437 | 1151 | |
| 2018 | 1580 | 607 | 2715 | 2188 | 1691 | 1394 | 2610 | 1186 | |
| 695 | 2428 | 2246 | 858 | 2036 | 1681 | 2449 | 1578 | 1971 | |
| 1846 | 1729 | 2389 | 1737 | 1913 | 1863 | 2072 | 2593 | 2287 | |
| 2220 | 2230 | 551 | 458 | 2626 | 2731 | 488 | 2551 | 1736 | |
| 1373 | 307 | 1803 | 2647 | 2679 | 1508 | 1468 | 1443 | 516 | |
| 1002 | 2116 | 2616 | 817 | 2522 | 460 | 1879 | 1999 | 1837 | |
| The level of significance of the test is ? = 0.05. Compute the relevant test statistic. | |||||||||
| This is a(n) _______ (two-tail, upper-tail, lower-tail) test. The test statistic is TS = _______. | |||||||||
| a | Two-tail test | TS = | 1.81 | ||||||
| Do not reject H?: ? ? 1500. Conclude that the population mean is not greater than 1500. | |||||||||
| b | Upper tail test. | TS = | 1.52 | ||||||
| Do not reject H?: ? ? 1500. Conclude that the population mean is not greater than 1500. | |||||||||
| c | Upper tail test. | TS = | 1.81 | ||||||
| Reject H?: ? ? 1500. Conclude that the population mean is greater than 1500. | |||||||||
| d | Lower tail test. | TS = | 1.98 | ||||||
| Do not reject H?: ? ? 1500. Conclude that the population mean is no greater than 1500. | |||||||||
| 4 | Consider the following hypothesis test. | ||||||||
| H?: ? ? | 30 | ||||||||
| H?: ? > | 30 | ||||||||
| A random sample of n = 15 yielded the following observations | |||||||||
| 51 | 38 | 26 | 16 | 28 | |||||
| 57 | 20 | 33 | 35 | 23 | |||||
| 21 | 47 | 56 | 54 | 36 | |||||
| Use ? = | 0.05 | ||||||||
| TS = ______ | CV = ______ | State the decision rule. | |||||||
| a | 1.68 | 1.761 | Do not reject H?. Conclude the mean is not greater than 30. | ||||||
| b | 1.68 | 1.64 | Reject H?. Conclude the mean is greater than 30. | ||||||
| c | 1.847 | 2.145 | Do not reject H?. Conclude the mean is not less than 30. | ||||||
| d | 1.847 | 1.761 | Reject H?. Conclude the mean is less than 30. | ||||||
| 5 | In a recent study, a major fast food restaurant had a mean service time of 165 seconds. The company embarks on a quality improvement effort to reduce the service time and has developed improvements to the service process. The new process will be tested in a sample of stores. The new process will be adopted in all of its stores, if it reduced mean service time by more than 45 seconds compared to the current mean service time. To perform the hypothesis test, the sample of 48 stores yields the following data (seconds). | ||||||||
| 90 | 96 | 133 | 108 | 136 | 110 | 119 | 138 | ||
| 129 | 98 | 101 | 92 | 135 | 124 | 115 | 90 | ||
| 132 | 125 | 110 | 124 | 126 | 138 | 94 | 130 | ||
| 108 | 96 | 140 | 135 | 102 | 114 | 109 | 137 | ||
| 138 | 104 | 108 | 134 | 92 | 107 | 96 | 119 | ||
| 105 | 111 | 96 | 136 | 126 | 116 | 98 | 131 | ||
| Use ? = | 0.05 | ||||||||
| |TS| = ______ | |CV| = ______ | ||||||||
| a | 1.548 | 1.678 | Do not reject H?. The mean service time is not reduced by more than 45 seconds. Do not adopt the new process. | ||||||
| b | 1.871 | 1.678 | Reject H?. The mean service time is reduced by more than 45 seconds. Adopt the new process. | ||||||
| c | 1.871 | 1.640 | Do not reject H?. The mean service time is not reduced by more than 45 seconds. Do not adopt the new process. | ||||||
| d | 1.548 | 1.640 | Reject H?. The mean service time is reduced by more than 45 seconds. Adopt the new process. | ||||||


Related textbook solutions


Related questions
Question 1
Which of the following approaches to understanding and predicting consumer behavior depends primarily on the knowledge and experience of a firm's employees and its suppliers?
| Test marketing and price experiments | ||
| Analysis of historical data. | ||
| Direct consumer surveys. | ||
| Expert opinion. |
Question 2
In which of the following situations would reliance on expert opinion as a basis for a managerial decision be most preferred?
| When the product being marketed is relatively new. | ||
| When the level of economic activity can have a significant effect on the demand for the firm's output. | ||
| When the product can be packaged with a variety of price and quality combinations. | ||
| When the business in question serves as a supplier of inputs to other businesses, especially in multi-product situations where other strategies may be prohibitively expensive. |
Question 3
The approach to analyzing consumer behavior that asks consumers to rank and choose among different product attributes to reveal their relative valuation of different characteristics is called:
| conjoint analysis. | ||
| contingent valuation. | ||
| the hedonic estimation technique. | ||
| a direct consumer survey. |
Question 4
All of the following are limitations of direct consumer surveys except:
| the possibility of response biases because survey respondents may not want to reveal their true preferences. | ||
| the possibility that the type of questions asked may unintentionally bias the respondent's answers. | ||
| the likelihood that respondents will deliberately and systematically mislead interviewers. | ||
| the possibility that consumers' responses may not reflect their actual behavior in the market place. |
Question 5
Which of the following approaches to understanding and predicting consumer behavior does not actually solicit any information from potential customers?
| Expert opinion. | ||
| Test marketing. | ||
| Analysis of historical data. | ||
| Conjoint analysis. |
Question 6
Data collected on a sample of individuals with different characteristics at a specific point in time are called:
| panel data. | ||
| cross-section data. | ||
| time series data. | ||
| none of the above. |
Question 7
Which of the following approaches to understanding and predicting consumer behavior provides the most insight into how consumers can be expected to respond in an actual market setting?
| Test marketing. | ||
| Conjoint analysis. | ||
| Expert opinion. | ||
| Analysis of historical data. |
Question 8
An approach to analyzing consumer behavior in which consumer reaction to different prices is analyzed in a laboratory situation or a test market is called:
| non-price experiments. | ||
| focus groups. | ||
| price experiments. | ||
| none of the above. |
Question 9
Data collected on the same observation unit at a number of points in time are called:
| panel data. | ||
| time series data. | ||
| cross-section data. | ||
| none of the above. |
Question 10
A measure of how much the coefficient would vary in regressions based on different samples is called:
| F-statistic. | ||
| standard error of the estimated coefficient. | ||
| t-statistic. | ||
| partial F-statistic. |
Question 11
The test statistic used to test the hypothesis of whether a regression coefficient is significantly different from zero, holding all other independent variables constant, is called a(n):
| t-test. | ||
| F-test. | ||
| multicollinearity test. | ||
| autocorrelation test. |
Question 12
Regression analysis that analyzes the relationship between one dependent variable and several independent variables is called:
| cluster analysis. | ||
| correlation analysis. | ||
| multiple regression analysis. | ||
| simple regression analysis. |
Question 13
The ratio of the regression coefficient to its standard error is called:
| F-statistic. | ||
| t-statistic. | ||
| coefficient of determination. | ||
| partial F-statistic. |
Question 14
The coefficient of determination will range between what values?
| -1 and +1 | ||
| 0 and 1 | ||
| -3 and +3 | ||
| none of the above |
Question 15
The range of values in which we can be confident that the true regression coefficient lies within a given degree of probability is called a:
| confidence interval. | ||
| logistic regression. | ||
| prediction interval. | ||
| none of the above. |
Question 16
The estimated regression equation is Y = 10 + 2.5X, if X =0 than the predicted value of Y is equal to
| 2.5 | ||
| 7.5 | ||
| 12.5 | ||
| 10 |