STAB22H3 Lecture 11: Patterns in Residual Plots, Outliers, Leverage, & Influence

12 Feb 2019
School
Department
Course
Professor
STAB22H3 verified notes
11/18View all
10
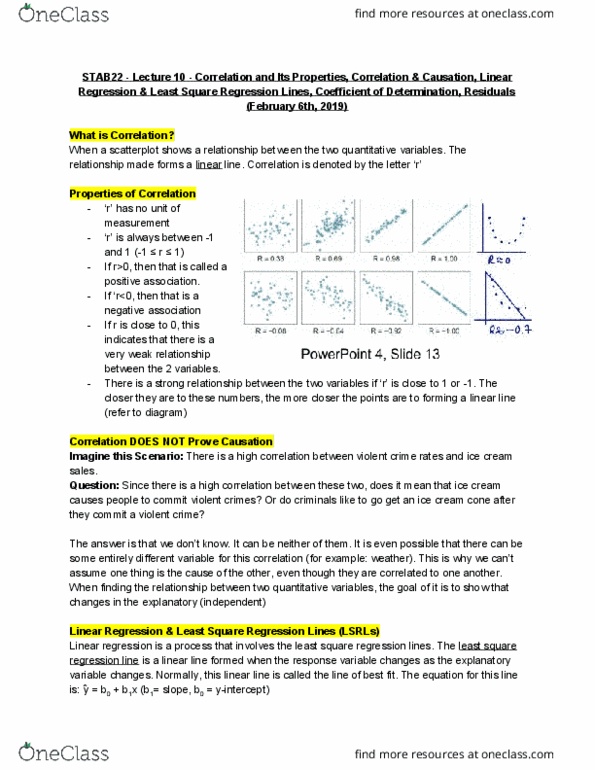
STAB22H3 Lecture 10: Correlation and Its Properties, Correlation & Causation, Linear Regression & Least Square Regression Lines, Coefficient of Determination, Residuals
11
STAB22H3 Lecture 11: Patterns in Residual Plots, Outliers, Leverage, & Influence
12
STAB22H3 Lecture Notes - Lecture 12: Scatter Plot, Microsoft Powerpoint, Dependent And Independent Variables
Document Summary
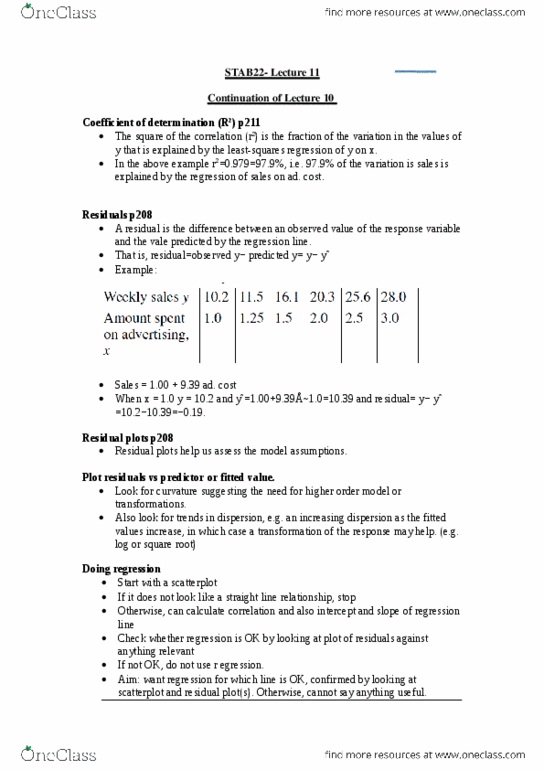
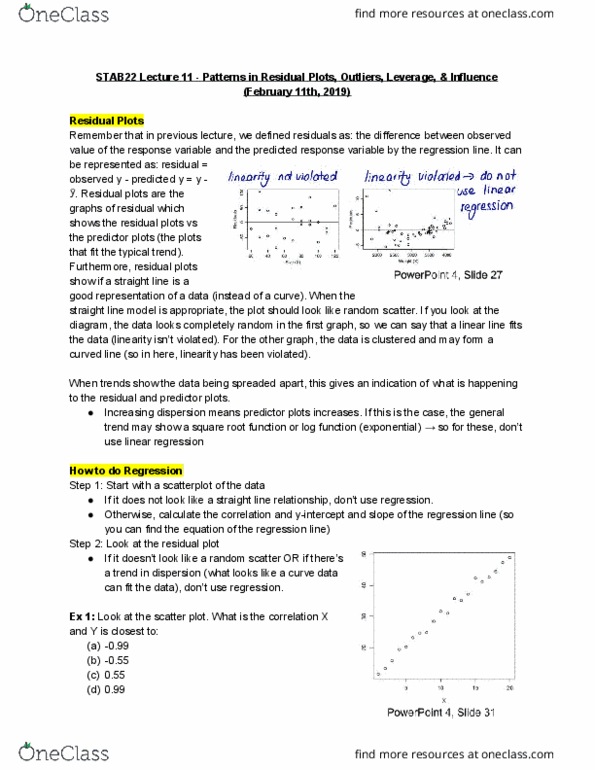
Stab22 lecture 11 - patterns in residual plots, outliers, leverage, & influence (february 11th, 2019) Remember that in previous lecture, we defined residuals as: the difference between observed value of the response variable and the predicted response variable by the regression line. It can be represented as: residual = observed y - predicted y = y - Residual plots are the graphs of residual which shows the residual plots vs the predictor plots (the plots that fit the typical trend). Furthermore, residual plots show if a straight line is a good representation of a data (instead of a curve). When the straight line model is appropriate, the plot should look like random scatter. If you look at the diagram, the data looks completely random in the first graph, so we can say that a linear line fits the data (linearity isn"t violated).