STAB22H3 Lecture Notes - Lecture 5: Dependent And Independent Variables, Scatter Plot


38
STAB22H3 Full Course Notes
Verified Note
38 documents
Document Summary
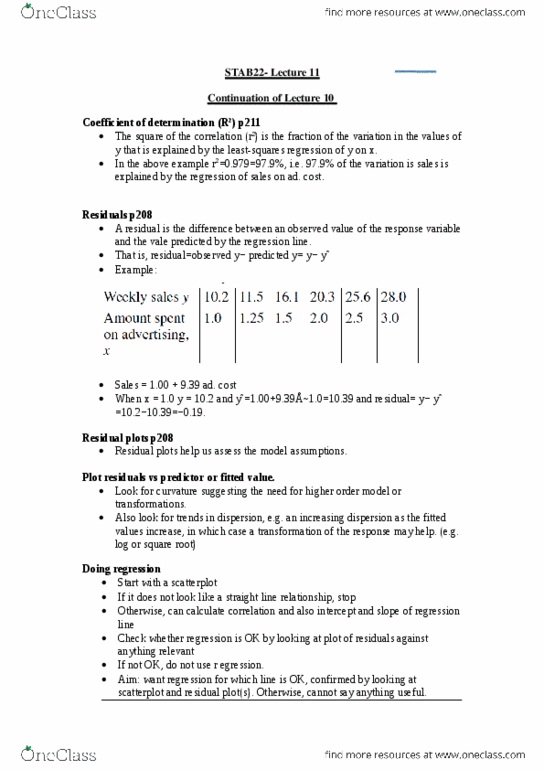
Coefficient of determination (r^2): r^2 fraction of variation in y values explained by least square regression. Residual: diff between observed value of response variable & predicted value = observed y - predicted y. Residual plot: residual against predicted value random scatter = good cuz original is st line vs if trend = take log or square root of response. X use regression when: scatterplot x st line relationship, residual plot x random scatter. Trend must check residual even if scatterplot is st line ( residual histogram to see if. Multiple modes) sometimes discover gps of observations separate into diff scatterplots. High leverage point: x-value greatly differs from mean. Influential point: value that v. diff regression line when omitted. Restrict range observed may = decrease in correlation.