PHTY211 Lecture Notes - Lecture 4: Grou, Inter-Rater Reliability, Performance Today


Analysis of quantitative data
• Choose the appropriate statistical method to analyse quantitative data
o To choose the appropriate statistical test, it must be suitable for
• The research design
• Type of measure represented by your data
• Distribution of the data
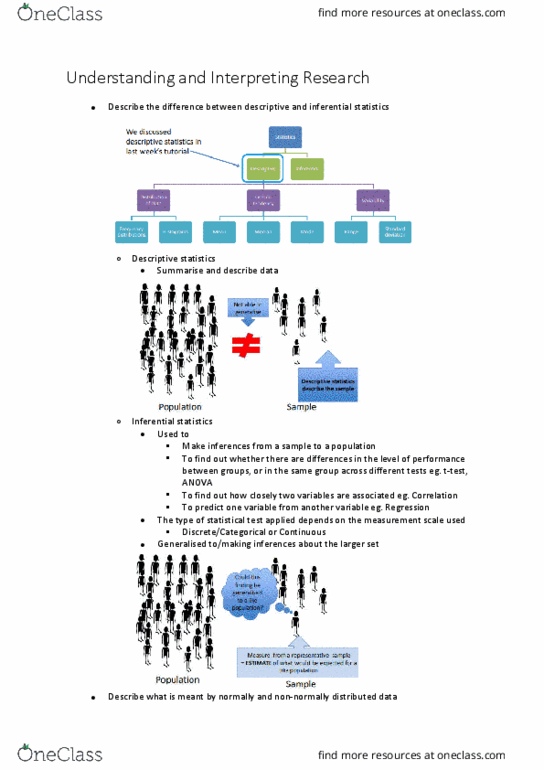
o Descriptive analysis
• Describe the data
▪ Range, minimum, maximum, and frequency
▪ Central tendency: mean, mode, median
▪ Spread/ variation: SD/ IQR
o Inferential analysis
• Parametric & o‐paraetri
• Is it valid to generalise the findings of this data?
• Is this finding due to chance?
o Research designs (inferential)
• Investigate association (relationship)
▪ Correlation
• Test for differences between variables or groups
▪ Compare means/medians
▪ Compare proportions
• Regression
▪ Does one variable predict a change in another variable
o Type of measure
• It must be suitable for the type of measure represented by your data
▪ Continuous data
▪ Discrete data
find more resources at oneclass.com
find more resources at oneclass.com

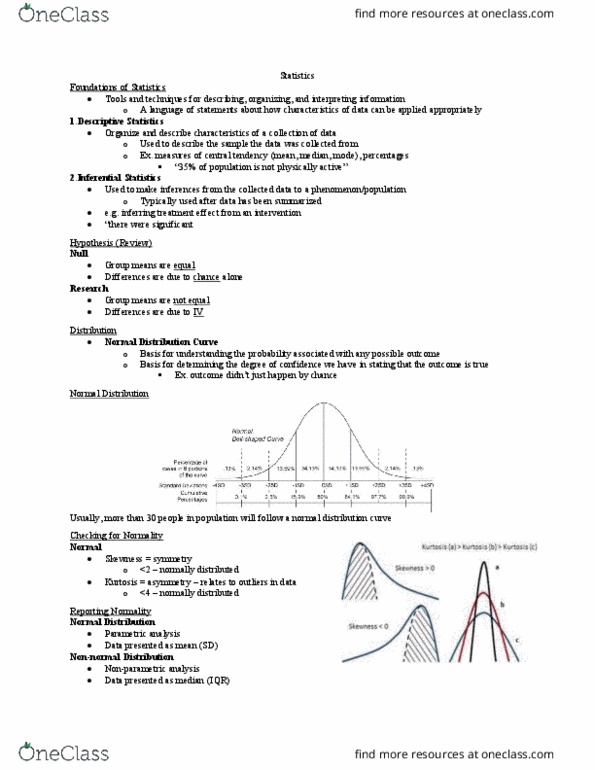
o Distribution of data
• To choose the appropriate statistical test, it must be suitable for the
distribution of the data
▪ Normally distributed data: use parametric test (e.g. mean)
▪ No‐orall distributed data: use a nonparametric test (e.g. median)
• Interpret statistical analysis of differences and relationships and interpret the results of
inferential statistical procedures such as ANOVA
o Independent t‐test
• Comparison of the difference between 2 independent variables (e.g.
when 2 independent groups are compared)
• Is there a demonstrated difference between experiment and control group?
• Study:
▪ To test the hypothesis that a new splint design will improve hand streng
th in people with arthritis (rheumatoid:RA)
• Sample:
▪ 20 people with RA with similar deformity in wrist/hand
▪ Random allocation to groups
▪ Experimental (n=10) wear splint 1 week + regular activities
▪ Control (n=10) no splint + regular activities
▪ Test both groups on day 1 and day 8
• Results
o Paired t‐test
• Comparison between 2 related variables
• Is there a demonstrated difference in outcome (DV) between the partiipat’s
performance today versus tomorrow?
• Repeated measures on the same participant
▪ Looking for changes within subjects
• Comparison of the difference between 2 measures (DV) taken on t
he same participant
• So that the participants scored are compared with themselves or t
heir match.
▪ May also be looking for differences between groups across time
• Repeated measures ANOVA
• Looking for interaction effects i.e. is there a difference within
subjects and between groups?
• When is the t-test not appropriate
▪ When data is not normally distributed, use o‐paraetri test
▪ When the difference between more than 2 means are being compare ->
ANOVA
find more resources at oneclass.com
find more resources at oneclass.com
Document Summary
Is this finding due to chance: research designs (inferential) Investigate association (relationship: correlation, test for differences between variables or groups, compare means/medians, compare proportions, regression, does one variable predict a change in another variable, type of measure. Interpret statistical analysis of differences and relationships and interpret the results of inferential statistical procedures such as anova. Independent t test: comparison of the difference between 2 independent variables (e. g. when 2 independent groups are compared) Study: to test the hypothesis that a new splint design will improve hand streng th in people with arthritis (rheumatoid:ra) Is there a demonstrated difference in outcome (dv) between the parti(cid:272)ipa(cid:374)t"s performance today versus tomorrow: repeated measures on the same participant. Looking for changes within subjects: comparison of the difference between 2 measures (dv) taken on t he same participant. So that the participants scored are compared with themselves or t heir match: may also be looking for differences between groups across time, repeated measures anova.