PHTY211 Lecture Notes - Lecture 3: Standard Score, Alternative Hypothesis, Standard Deviation


Understanding and Interpreting Research
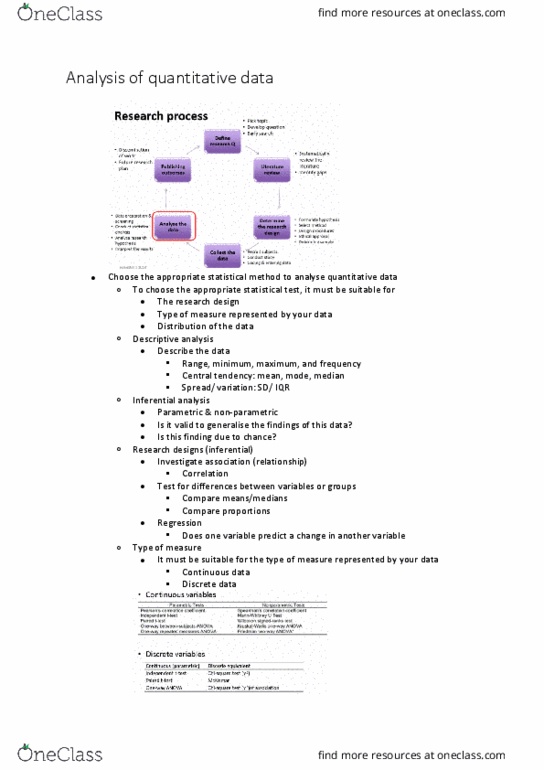
• Describe the difference between descriptive and inferential statistics
o Descriptive statistics
• Summarise and describe data
o Inferential statistics
• Used to
▪ Make inferences from a sample to a population
▪ To find out whether there are differences in the level of performance
etee groups, or i the sae group aross differet tests eg. t‐test,
ANOVA
▪ To find out how closely two variables are associated eg. Correlation
▪ To predict one variable from another variable eg. Regression
• The type of statistical test applied depends on the measurement scale used
▪ Discrete/Categorical or Continuous
• Generalised to/making inferences about the larger set
• Desrie hat is eat y orally ad o‐orally distriuted data
find more resources at oneclass.com
find more resources at oneclass.com

o Analysis of continuous data depends on the distribution of the sample data
▪ Normal
• Bell ure
▪ Non-normal
• Skewed
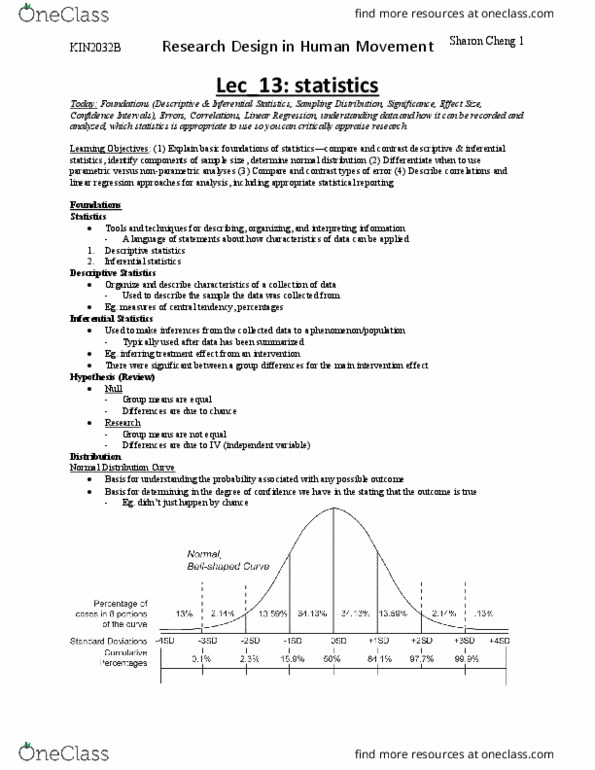
o Population: normal distribution
▪ Most important distribution for continuous random variables
▪ Occurs for many naturally occurring phenomena in a population e.g. blood
pressure, height, weight, scores on tests
▪ Normal distribution of population
• Symmetrical (50% of score below and 50% above the mean)
• Mean, median & mode are equal
• Defined in terms of mean & spread (variability) of the data
▪ It is descried y to paraeters μ a easure of etre - ea ad σ a
measure of spread - SD)
o Normal distribution
▪ Any score within the distribution (of the population) can be standardised in
relation to mean and SD
• Ho ay “D’s aoe or elo ea
• Z score = no. of “D’s fro the populatio ea a data poit is
• Mean of 0 and SD of 1
• Percentage of scores within a certain range of scores is known
• Area under the curve of normal distribution allows the calculation of
probability
▪ The distribution of data determines which statistical test will provide the valid
answer
▪ e.g. Mean gives a valid measure of central tendency if data is normally
distributed but
• Is misleading if data is skewed
• Is meaningless for categorical data
▪ Parametric test used for normally distributed data
o Non-normal distribution
find more resources at oneclass.com
find more resources at oneclass.com
Document Summary
Understanding and interpreting research: describe the difference between descriptive and inferential statistics, descriptive statistics. Inferential statistics: used to, make inferences from a sample to a population, to find out whether there are differences in the level of performance (cid:271)et(cid:449)ee(cid:374) groups, or i(cid:374) the sa(cid:373)e group a(cid:272)ross differe(cid:374)t tests eg. t test, Skewed: population: normal distribution, most important distribution for continuous random variables, occurs for many naturally occurring phenomena in a population e. g. blood pressure, height, weight, scores on tests, normal distribution of population. Symmetrical (50% of score below and 50% above the mean: mean, median & mode are equal, defined in terms of mean & spread (variability) of the data. Standard deviation of the sample/square root of number in the sample: confidence intervals, a range of values we are fairly sure our true value lies in, most often report 95% ci, 95%ci = mean 1. 96 x sem.