STAT 301 Study Guide - Quiz Guide: Polynomial Regression, Dependent And Independent Variables, Quadratic Function

Document Summary
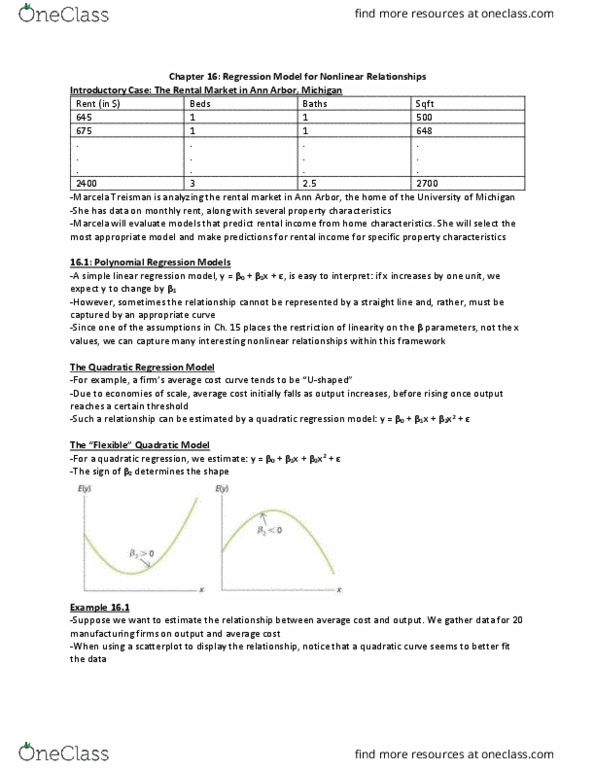
If we have a curved pattern on a scatterplot, it would not make sense to model it linearly, but that doesn"t mean there is no relationship between x and y. One way to model the relationship is to transform the explanatory variable i. e. , using log (x) or x in regression instead of x. Model: y = 0 + 1 x + . More common way polynomial regression i. e. , fit data to y = 0 + 1x + 2x2 + for a quadratic function. Can do polynomial regression using xk, for k 1, but we want to include all lower order terms of x in the model as well. So if we were to fi a 5 degree polynomial, we would use y = b0 + b1x + b2x2 + b3x3 + b4x4 + b5x5. Sometimes y is strongly related to several explanatory variables while not having a strong relationship with any one single explanatory variable.