ECON1101 Study Guide - Final Guide: Ceteris Paribus, Economic Equilibrium, Demand Curve


The Supply and Demand Model
Demand
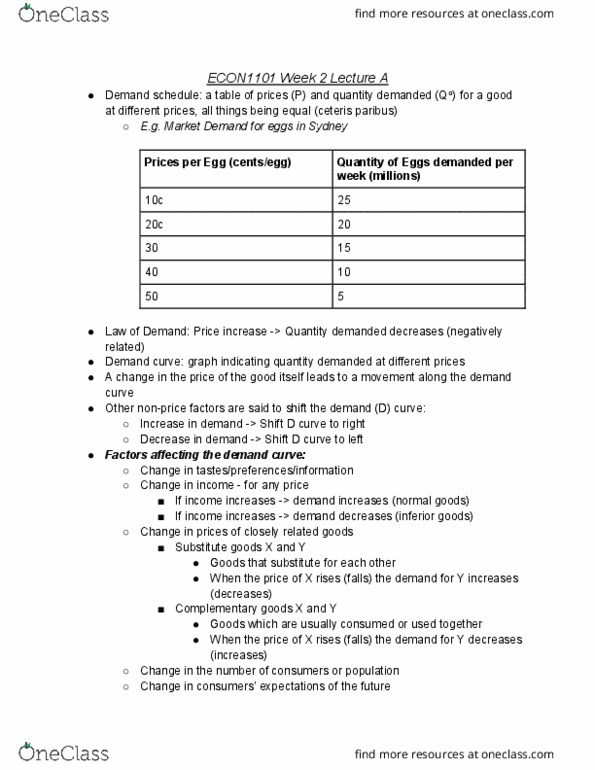
• Demand schedule - a tabular presentation of demand showing the P and Q demanded for a
particular good, ceteris paribus.
• Law of demand – P increases → Q decreases.
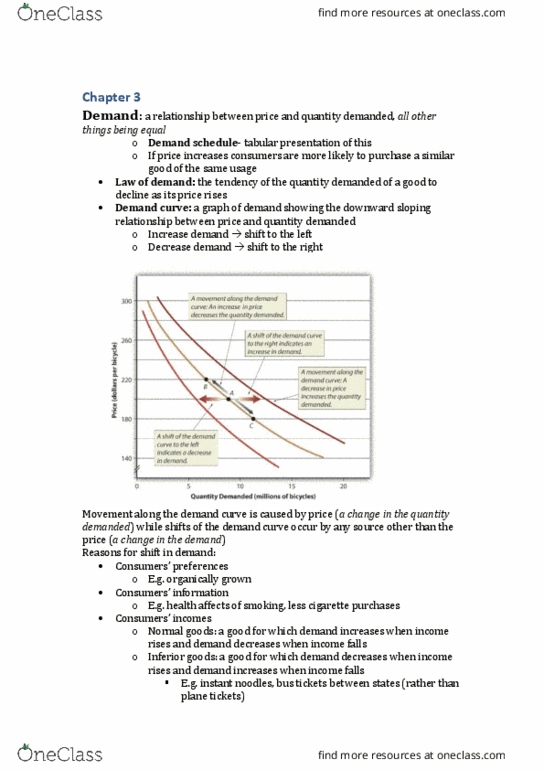
• Demand curve - downward-sloping.
• *The demand curve also indicates the willingness to pay, i.e. the highest price that will be paid
for the last unit purchased.
• A change in the price of the good, (which means QD changes) leads to a movement along the
curve.
• A change in demand caused by any non-price factors shift the curve.
• An increase in demand shifts the demand curve to the right, whereas a decrease in demand
shifts to the left.
• Reasons for demand curve shifts:
➢ Changes in tastes, preferences and information.
➢ Changes in income – if income increases, the sales of normal goods will increase, but
the same of inferior/generic goods decrease.
➢ Changes in price of closely related goods
a) Substitute goods - price of X rises, demand for Y increases.
b) Complementary goods – price of X rises, demand for Y decreases.
➢ Changes in number of consumers in the market
➢ Chages i cosuers’ expectatios of the future – eg: demand increases if people
expect the future price of the good to rise.
Supply
• Supply schedule - a table of prices (P) and quantity supplied (Qs) for a good at different
prices, ceteris paribus.
• Law of supply – P increases → Q increases (positively related).
• Supply curve - upward-sloping, (the supply curve refers to all the firms producing the
product).
• A change in the price of the good itself leads to movement along the supply curve.
• A shift occurs if a change is caused by any non-price factors, eg: weather.
• Reasons for supply curve shifts:
➢ Change in technology – anything that changes Q of outputs for a given amount of
inputs, eg: weather.
➢ Change in price of inputs – eg: raw materials, labour.
➢ Change in no. of firms in market – if no. of firms increases then supply increases.
➢ Changes in expectations for future prices – eg: Valetie’s Day: plan for roses to
bloom in Feb.
➢ Changes in gov. taxes, subsidies and regulations:
o Taxes increase firms' costs → reduce supply.
o Subsidies (payments to firms from gov.) reduce firms' costs → increase supply.
o Regulations change firms' costs of production or their ability to produce goods.
Market Equilibrium: Combining Supply and Demand
• Shortage/excess demand - QD > QS→ price rises.
• Surplus/excess supply – QS > QD → price falls.
• Equilibrium price – the price in which QS = QD.
• Equilibrium quantity – the quantity traded at the equilibrium price.
• Market is in equilibrium when QD = QS and the price is stable.
find more resources at oneclass.com
find more resources at oneclass.com
Document Summary
Changes in income if income increases, the sales of normal goods will increase, but the same of inferior/generic goods decrease. Changes in price of closely related goods: substitute goods - price of x rises, demand for y increases, complementary goods price of x rises, demand for y decreases. Changes in number of consumers in the market. Cha(cid:374)ges i(cid:374) co(cid:374)su(cid:373)ers" expectatio(cid:374)s of the future eg: demand increases if people expect the future price of the good to rise. Supply: supply schedule - a table of prices (p) and quantity supplied (qs) for a good at different prices, ceteris paribus. Change in technology anything that changes q of outputs for a given amount of inputs, eg: weather. Change in price of inputs eg: raw materials, labour. Change in no. of firms in market if no. of firms increases then supply increases. Changes in expectations for future prices eg: vale(cid:374)ti(cid:374)e"s day: plan for roses to bloom in feb.