ECON1101 Lecture Notes - Lecture 4: Ceteris Paribus, Demand Curve, Complementary Good


ECON1101 Week 2 Lecture A
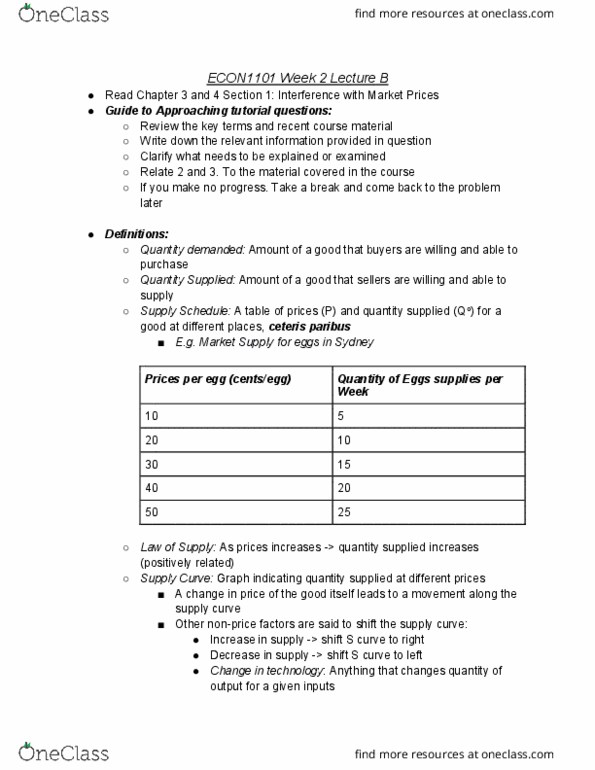
● Demand schedule: a table of prices (P) and quantity demanded (Qo) for a good
at different prices, all things being equal (ceteris paribus)
○ E.g. Market Demand for eggs in Sydney
Prices per Egg (cents/egg)
Quantity of Eggs demanded per
week (millions)
10c
25
20c
20
30
15
40
10
50
5
● Law of Demand: Price increase -> Quantity demanded decreases (negatively
related)
● Demand curve: graph indicating quantity demanded at different prices
● A change in the price of the good itself leads to a movement along the demand
curve
● Other non-price factors are said to shift the demand (D) curve:
○ Increase in demand -> Shift D curve to right
○ Decrease in demand -> Shift D curve to left
● Factors affecting the demand curve:
○ Change in tastes/preferences/information
○ Change in income - for any price
■ If income increases -> demand increases (normal goods)
■ If income increases -> demand decreases (inferior goods)
○ Change in prices of closely related goods
■ Substitute goods X and Y
● Goods that substitute for each other
● When the price of X rises (falls) the demand for Y increases
(decreases)
■ Complementary goods X and Y
● Goods which are usually consumed or used together
● When the price of X rises (falls) the demand for Y decreases
(increases)
○ Change in the number of consumers or population
○ Change in consumers’ expectations of the future
find more resources at oneclass.com
find more resources at oneclass.com
Document Summary
Demand schedule: a table of prices (p) and quantity demanded (qo) for a good. Econ1101 week 2 lecture a at different prices, all things being equal (ceteris paribus) Law of demand: price increase -> quantity demanded decreases (negatively related) Demand curve: graph indicating quantity demanded at different prices. A change in the price of the good itself leads to a movement along the demand curve. Other non-price factors are said to shift the demand (d) curve: Increase in demand -> shift d curve to right. Decrease in demand -> shift d curve to left. Change in income - for any price. If income increases -> demand increases (normal goods) If income increases -> demand decreases (inferior goods) Change in prices of closely related goods. When the price of x rises (falls) the demand for y increases (decreases) Goods which are usually consumed or used together. When the price of x rises (falls) the demand for y decreases (increases)