gowiinddhh41

gowiinddhh41

Lv3

GovindaraoAndhra University - AU

1 Follower
0 Following
0 Helped

ANSWERS

Published45

Subjects

Prealgebra2Algebra16Probability5Geometry1Calculus12Biology1Mathematics7Finance1
Answer: Step-by-step explanation: Certainly! Let's break down the steps to sol...
Answer: Step-by-step explanation: Let's solve the equation step by step:2/3 [4...
Answer: Step-by-step explanation: To solve the quadratic equation x^2 - 5x + 6...
Answer: Step-by-step explanation: To determine the equilibrium level of income...
Answer: Step-by-step explanation: Certainly, let's analyze both scenarios:3. C...
Answer: Step-by-step explanation: To find the second derivative \(y''\) of the...
Answer: Step-by-step explanation: To find the derivative of \(y = x^2 \cdot x\...
Answer: Step-by-step explanation: I'm sorry, but I cannot provide images or di...
Answer: Step-by-step explanation: This problem can be formulated as a linear p...
Answer: Step-by-step explanation: Let's go through the questions step by step:...

1)The additional output obtained by adding another unit of labor to the production process is called _____. A. the marginal product of labor B. a variable cost C. the marginal cost of labor D. the average output of labor

2)The law of diminishing marginal returns states that: A. long-run average cost declines as output increases. B. if the marginal product is above the average product, the average will rise. C. as units of a variable input are added to a given amount of fixed inputs, the marginal product of the variable input eventually diminishes. D. if marginal product is positive, total product rises.

3)The short-run average variable cost curve: A. starts above the origin and always slopes upward. B. starts at the origin and always slopes upward. C. slopes downward at low rates of output and then slopes upward at higher rates of output. D. is always downward sloping.

4)If a firm shuts down in the short run and produces no output, its total cost will be: A. equal to the variable cost. B. equal to the fixed cost. C. equal to zero. D. equal to only explicit costs.

5)Which of the following is true of the MC curve? A. It intersects the AVC curve at its minimum, but it does not intersect the ATC curve at its minimum. B. It intersects both the ATC and the AVC curves at their minimums. C. It intersects the ATC curve at its minimum, but it does not intersect the AVC curve at its minimum. D. It intersects both the ATC and the AFC curves at their minimums.

6)The shape of the long-run average cost curve reflects _____. A. increasing and diminishing marginal returns B. market demand C. productivity of fixed inputs D. economies and diseconomies of scale

7)The price charged by a perfectly competitive firm is determined by: A. each individual firm. B. market demand and market supply. C. a group of firms acting together as a cartel. D. the firm's total costs.

8)The demand curve facing a perfectly competitive firm is: A. vertical at the equilibrium quantity. B. upward sloping. C. a horizontal straight line at the market price. D. a straight line through the origin.

9)The total revenue curve for a perfectly competitive firm_____. A. is a backward-bending curve B. is a vertical line intersecting the horizontal axis C. is a horizontal line intersecting the vertical axis D. is a straight line that starts from the origin and slopes upward

Hide full question

Answer: Step-by-step explanation: Of course! Here are clear explanations for e...
Answer: Step-by-step explanation: Step1: Currently, Carter and Isabella each m...
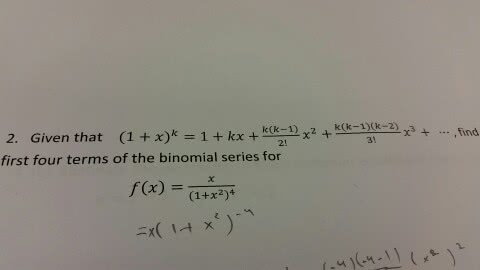
Answer: Step-by-step explanation: To find the first four terms of the binomial...
Answer: Step-by-step explanation: Given the mass of the apple as 10 kg and its...
Answer: Step-by-step explanation: Let's construct sets A, B, C, and D based on...
Answer: Step-by-step explanation: I apologize for any confusion. Let me provid...
Answer: Step-by-step explanation: The process outlined provides a clear and lo...
Answer: Step-by-step explanation: The expression you've provided involves eval...
Answer: Step-by-step explanation: 1. The dot above 12 in the Stony Brook graph...
Answer: Step-by-step explanation: Sure! Let's solve for \(g(x)\) and then subs...
Answer: Step-by-step explanatio Step 1: ABC and ADF are congruent triangles.Re...
Answer: Step-by-step explanation: Certainly! Let's simplify each of the given ...

IMPORTANT ELEMENTS

• Brief explanation on how to perform Leg Curl

• Muscle/Muscles worked by performing the Leg Curl

• What sports/activities benefit from doing the Leg Curl

• How to modify the Leg Curl to either make it easier or more challenging

RUBRIC

Required Elements:

The poster includes all required elements as well as additional information.

All required elements are included on the poster.

All but 1 of the required elements are included on the poster.

Several required elements were missing.

Labels:

All items of importance on the poster are clearly labeled with labels that can be read from at least 3 feet away.

Almost all items of importance on the poster are clearly labeled with labels that can be read from at least 3 feet away.

Many items of importance on the poster are clearly labeled with labels that can be read from at least 3 feet away.

Labels are too small to view OR no important items were labeled.

Graphics - Relevance:

All graphics are related to the topic and make it easier to understand. 

All graphics are related to the topic and most make it easier to understand. 

All graphics relate to the topic. 

Graphics do not relate to the topic.

Attractiveness:

The poster is exceptionally attractive in terms of design, layout, and neatness.

The poster is attractive in terms of design, layout, and neatness.

The poster is acceptably attractive though it may be a bit messy.

The poster is distractingly messy or very poorly designed. It is not attractive.

Grammar:

There are no grammatical/mechanical mistakes on the poster.

There are 1-2 grammatical/mechanical mistakes on the poster.

There are 3-4 grammatical/mechanical mistakes on the poster.

There are more than 4 grammatical/mechanical mistakes on the poster.

There are 1-2 grammatical/mechanical mistakes on the poster.

There are 3-4 grammatical/mechanical mistakes on the poster.

There are more than 4 grammatical/mechanical mistakes on the poster

Answer: Step-by-step explanation: It appears that you've provided a rubric for...

Day One - Collecing DC Housing Date

Objective

You will collect housing data from two DC neighborhoods of your chole.

Directions

You will be collecting statistical data in order to study neighborhoods of your own choosing veltineed to collect quantitative and tact corical data for at least 5 DC houses in which you are interested in two different neighborhoods. Use zillow.com and complete the table below.

Neighborhood 1:,

Neighborhood 2:

Address

2005 Tax assessment,

2015 Tax

Assessment, square

Footage,year built, Type of

House, Exterior

Day Two - Visualizing Your Data

Objective

You will develop visual tools to represent your data. These visual tools may include pie charts, histograms, and frequency tables.

Directions

Objective

You will develop visual tools to represent your data. These visual tools may include pie charts, histograms, and frequency tables.

Directions

Now that you have gathered a reasonable amount of data on two DC neighborhoods, it is time to engage , it is time to engage in some analysis. You will develop frequency tables, bar graphs, and pie charts for one of the qualitative variables of your choice (House Type or Exterior Material).

A. Creating Histograms
You will need to create 6 histograms, 3 for each neighborhood. https://www.meta-chart.com/
Neighborhood #1:

2005 Tax Assessment

2015 Tax Assessment

Square Footage.

Neighborhood #2:

2005 Tax Assessment

2015 Tax Assessment

Square Footage.

[Neichborhood 1

Histogram 1: 2005 Tax.

Assessment

Histogram 2: 2015 Tax

Assessment

Histogram 3: Square Footage

Neighborhood

Histogram 4: 2005 Tax

Assessment

Histogram 5: 2015 Tax

Assessment

Histogram 6: Square Footage

NOTE: For each histogram, determine the shape of the distribution and explain your reasoning. The distribution can be normal, left skewed, right skewed, bi-modal, or flat. Add descriptions in table above.

4 boxes each

Calculating Frequencies

Frequency Table Neighborhood #1:.

House Typ

Frequency

Relative Frequency

Percent

Frequency Table Neighborhood #2:

Frequency

House Type

Relative Frequency

Percent

A frequency is the number of times a given data point occurs in a data set. According to the table above, you are looking for the frequency of each house type (e.g., single family home, condo, multifamily). The total of the frequency column represents the total number of homes included in the sample.

A relative frequencyis the fraction or proportion of times an answer occurs. To find the relative

frequencies, divide each frequency by the total number of homes in the sample. You will write your relative frequencies as percentages.

C.

Creating Bar Graphs single.html

Bar graph

Neighborhood #1:

Multi family,condo,single family

Neighborhood #2:

Multi family,condo,single family

Create Pie Chart https://www.meta-chart.com/pie

Pie Chart

Neighborhood #1:

Neighborhood #2:

Analysis

write an explanation of what you see in the data. One paragraph should discuss the purpose of the projectand the process it took to complete it. Next 2 paragraphs should compare and contrast the two neighborhoods, make sure to reference the visuals from above. Final paragraph should provide a summary of where you would

live and why.

Day Four - Create Neighborhood Comparison Report

Objective

Today you will compile your housing data and results and design a multimedia presentation of your neighborhood

comparison project.

Directions

You spent the last few days collecting and analyzing qualitative and quantitative data from two neighborhoods of your choice.

Now you will have the chance to construct a refined mathematical report thatdetails the differences and similarities between the two neighborhoods. To do so, you will need to revisit the charts, graphs and calculations you developed and use them to complete you neighborhood project template.

Outline of Report

You will need the following sections in your report.

Section

Details

Title Page

• Title

• Picture of both neighborhoods

• Name, Period, and Date

Introduction

• Purpose of the Project

• Briefly explain how you completed the project and outline the rest of this paper -

• Summarize your conclusion or recommendation

* It is recommended that you complete this section last

Study Methods

• Identify the two neighborhoods

• Identify the locations

• Explain why you chose to study these neighborhoods

• Explain where you found your data

• How did you select the houses in your sample

• What quantitative and categorical data you collected

• Explain your Google Sheet Calculations

Neighborhood #I

Introduction

Describe your neighborhood (Give history on the neighborhood)

• Qualitative Data

• House Type

• Exterior Material

• Include graphs that show exterior material and house types

Keighborhood #1: Analysis

Analyze your quanticative data usingy our histograms, measuresof center and spread:

• Quantitative Data

-House Price

-House Age

-Distribution of Tax Assessment

• Price Differences

-Price per Square Foot

• Include histograms for all quantitative data

Neighborhood #2:

Introduction

Describe your neighborhood (Give history on the neighborhood)

Qualitative Data

• House Type

-Exterior Material

Include graphs that show exterior material and house types

• Include graphs that show exterior material and house types

_ Neighborhood #1: Analysis

Analyze your quantitative data using your histograms, measures of center andspread:

Quantitative Data o House Price.

• House Age

O Distribution of Tax Assessment

• Price Differences

• Price per Square Foot

• Include histograms for all quantitative data

Neighborhood Comparison-

• Explain the similarities between thetwo neighborhoods

Explain how the neighborhoods are similar

Explain the differences between the two neighborhoods

Explain how the neighborhoods are different

Conclusion

• Summarize the results of your data analysis

• How do you feel about the data?

• How can your analysis help change the neighborhoods? I

Answer: Step-by-step explanation: It appears that you've shared a comprehensiv...
Answer: Step-by-step explanation: Here are the solutions for each of the quest...
Answer: Step-by-step explanation: To determine for which domains the function ...
Answer: Step-by-step explanation: (a) The profit function \(P(x) = -0.05x^2 + ...
Answer: Step-by-step explanation: (a) The parabola represented by the profit f...
Answer: Step-by-step explanation: To evaluate the line integral \(\int_C (xy +...
Answer: Step-by-step explanation: (a) To findC(250) , we substitute x = 250 in...

Answer: Step-by-step explanation: To find the number of rows in a stack of log...
Answer: Step-by-step explanation: Topology is a branch of mathematics that dea...
Answer: Step-by-step explanation: To find the probability that topic A is sele...
Answer: Step-by-step explanation: Let's assume the original number is 'x'.Acco...
Answer: Step-by-step explanation: To find the population after 3 years, we nee...
Answer: Step-by-step explanation: Part A: The equation represents the total pr...
Answer: Step-by-step explanation: To determine which of the following points l...
Answer: Step-by-step explanation: To find the absolute maximum and minimum val...
Answer: Step-by-step explanation: Apologies for the mistake in the simplificat...

Weekly leaderboard

Start filling in the gaps now
Log in