datuit

datuit

Lv3

Jaypee University of Information Technology - JUIT

0 Followers
0 Following
4 Helped
I'm a new bie :vv

ANSWERS

Published43

Subjects

History3Management1English4Nursing1Psychology1Algebra6Geometry1Computer Science2Calculus4Biology4Mathematics9Physics1Finance1Economics2Chemistry3
Answer: A. Latin American countries were economically dependent on Western cou...
Answer: The correct chronological order of these events is: Cuba goes to war a...
Answer: A a European country establishing a new colony in Latin America
Answer: yes
Answer:Trial 1: 15 mL Trial 2: 15 mL Trial 3: 15 mL
Answer: Islamic economics, also known as Islamic finance or Shari'ah-compliant...
Answer: Through the character of Winston Churchill, John Wright's film The Dar...
Buffer pH can be calculated using the Henderson-Hasselbalch equation. This is ...
Answer: The American Customary System of Units is widely used in the United St...
Answer: Familiarity: The American Customary System of Units is widely used in ...
Answer: In the previous session, 11/22 of the dogs passed Dennis' obedience cl...
Answer: C. Red
Answer: To convert (mpg) to (km/L), can use the conversion factor of 1 mpg = 0...
Answer: Without more information, it is not possible to determine how much mon...
Answer: B. linking verb
Answer: Large cash reserves: If a company has large cash reserves, it can miti...
Answer: In right triangle DEF, angle E is a right angle, DE = 8, and EF = 6. T...
Answer: The equation for the roots 3 and 3/4 would be: (x - 3)(x - 3/4) = 0 Ex...
Answer: -x + 3 = x^2 + 1 Extension on the right: -x + 3 = x^2 + 1 Solve for x:...
Answer: Globalization brings several benefits to individuals and societies, in...
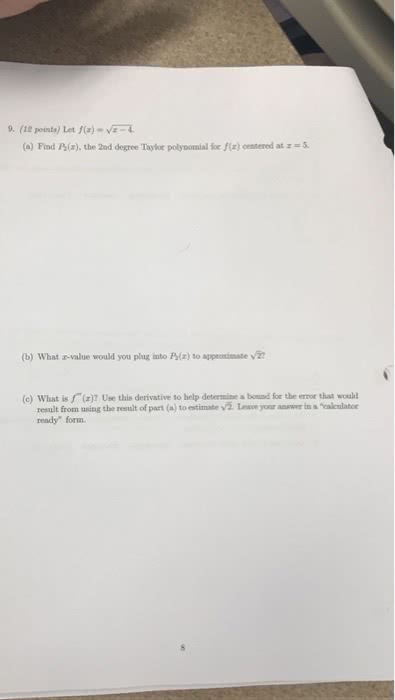
Answer: (a) To find the 2nd degree Taylor polynomial, P_2 (z), we need to find...
Answer: The force can be calculated using Newton's second law of motion. force...
Answer: The basic components of a cell and their functions are: Nucleus: The n...

Analyze and write about the results of a visual and an auditory lexical decision task. Analyze a large data set that includes students’ responses for both the visual and auditory modality. Lab is a write-up of these findings.

  1. One large data file that includes all experimental trial responses for both the Visual and Auditory modality tasks. Note that the sample size for the visual experiment is 16 and for the auditory experiment is 15.

Presentedz with visual words and pseudo-words in one experiment and auditory words and pseudo-words in a second experiment. Respond whether you saw/heard a real word of English or not. In the visual task, remained fixated on a cross (i.e., ‘+’) presented in the centre of the screen, while the stimulus was visually presented either to the left or right of the fixation point. In the auditory experiment, you heard words and pseudo-words presented either to your left or right ear.

  Words Pseudo-words Number 60 60 Pronounceable N/A Yes Hemi-field/Ear Presentation 30 left/30 right 30 left/30 right String Length

Range: 5-7

Mean: 6.01 (SD = 0.71)

Range: 5-7

Mean: 5.85 (SD = 0.78)

Phoneme Length

Range: 5-7

Mean: 5.45 (SD = 0.59)

Range: 3-6

Mean: 4.58 (SD = 0.87)

Number of Morphemes 1 N/A

In each experiment, there were 60 words and 60 pseudo-words. It was the same 120 items presented in each experiment. Only their modality of presentation changed. Thirty words and 30 pseudo-words were presented to the left (side of the screen in the visual experiment, ear in the auditory experiment), while the other 30 words and other 30 pseudo-words are presented to the right. Side of presentation was balanced across participants using two lists. Each list contained the same set of words and pseudo-words; only presentation side was counter-balanced across lists.

Independent samples t-tests revealed no difference in orthographic length between the words and pseudo-words (t(117) = -1.59, p = 0.11); there is, however, a reliable phoneme length difference between the words and pseudo-words (t(104.28) = -6.37, p < 0.001). We also recorded whether the participant was a native speaker of English or not and whether they are right- or left-hand dominant. Feel free to use these factors in your analysis.


  1. Given what you know about the organization of the visual and auditory pathways and lateralization of language processing, state, in very clear terms, what your predictions are. Provide specific predictions for your observation (dependent) variable(s), and select and name your predictor (independent) variable(s). 
  2.  
  3. Provide a detailed list of the processing steps in R that is performed to arrive at your results. For example, do you want to include incorrect trials trials in your analysis of both dependent variables? Do not provide the R code, but instead write out these steps in plain English.  
  4. Provide a series of plots that provide an illustration of your results. You should minimally include a plot of the accuracy and reaction time results and this should be done for each modality. You may also included histograms of your reaction time distributions, but this is not necessary. Be sure your axes are appropriately labeled. 
  5. Provide a table that presents your numerical findings in a clear manner. Remember to include both the sample-level averages and standard deviations per condition. 
  6. Discuss your results in light of the predictions in Q1 and your findings in Q3 and Q4. Make specific reference to your predictions and the extent to which they are borne out. 
  7. Get creative: Incorporate one other factor (e.g., native language, handedness). State your predictions and provide a breakdown of the data in terms of these factors. 
  8. Design your own research question: Consider how you might use the same experimental design to understand another linguistic phenomenon and population (e.g. stop VOT, vowel length, lexical tone, Mandarin speakers, French speakers etc.). State your research question, and provide and motivate specific predictions for your dependent variable(s) as a function of your predictor variable(s). Note: Ideally, the new research question will still involve language lateralization. Consult the Gazzaniga readings online for ideas based on the particular specializations of each hemisphere. 
Answer: The results of visual and auditory vocabulary decision tasks analyzed ...
Answer: Fraud and abuse of Medicare and Medicaid insurance can have serious co...
Answer: f(x) = -5(x - 1)^2 + 5
Answer: Crossovers increase phenotypic variability within populations. At cros...

Lab Report: Gene Mapping

Answer the questions below. When you are finished, submit this assignment to your teacher by the due date for full credit.

For all questions, assume that you have genes for beak color, tail-feather length, and feather color all linked (located) on the same chromosome, but you don't know the order of the genes on the chromosome or the distance between them. The alleles for these genes are

beak color: Y for yellow beak (YY and Yy) and y for black beak (yy)

tail-feather length: L for long tail (LL and Ll) and l for short tail (ll)

feather color: B for blue feathers (BB and Bb) and b for white feathers (bb)

Total score: Click or tap here to enter text. of 22 points

Part 1: Crossing Beak Color and Tail-Feather Length

Cross a YyLl (heterozygous parent with dominant traits) with yyll (homozygous parent with recessive traits). Look at the number of genotypes of the F1 generation:

YyLl: 400

Yyll: 100

yyLl: 100

yyll: 400

(Score for Question 1: Click or tap here to enter text. of 2 points)

1. Which offspring are the recombinant offspring in this cross?

Answer:

Type your answer here.Click or tap here to enter text.

(Score for Question 2: Click or tap here to enter text. of 2 points)

2. How far apart are Y and L? Give your answer in map units. (Hint: Add the numbers of the two recombinant types, divide by the total number of offspring, and multiply by 100.)

Answer:

Type your answer here.Click or tap here to enter text.

Part 2: Crossing Beak Color and Feather Color

Cross beak color and feather color.

(Score for Question 1: Click or tap here to enter text. of 2 points)

1. Cross one parent that is heterozygous for both beak color and feather color with a parent that is homozygous for both recessive traits. What are the genotypes of the parents? (Hint: Recall that the P generation includes a heterozygous parent with dominant traits and a homozygous parent with recessive traits.)

Assume the following F1 generation:

YyBb: 420

Yybb: 80

yyBb: 80

yybb: 420

Answer:

Type your answer here.Click or tap here to enter text.

(Score for Question 2: Click or tap here to enter text. of 2 points)

2. Which offspring are the recombinant offspring in this cross?

Answer:

Type your answer here.Click or tap here to enter text.

(Score for Question 3: Click or tap here to enter text. of 2 points)

3. How far apart are Y and B?

Answer:

Type your answer here.Click or tap here to enter text.

Part 3: Crossing Tail-Feather Length and Feather Color

Cross a P generation, LlBb with llbb. Assume the following F1 generation:

LlBb: 480

Llbb: 20

llBb: 20

llbb: 480

(Score for Question 1: Click or tap here to enter text. of 2 points)

1. Which offspring are not the recombinant offspring in this cross?

Answer:

Type your answer here.Click or tap here to enter text.

(Score for Question 2: Click or tap here to enter text. of 2 points)

2. How far apart are L and B?

Answer:

Type your answer here.Click or tap here to enter text.

Part 4: Mapping Beak Color, Tail-Feather Length, and Feather Color

Now you are ready to figure out the order of the genes for beak color, tail-feather length, and feather color on the chromosome and build a genetic map.

(Score for Question 1: Click or tap here to enter text. of 2 points)

1. List the distances between each pair of genes:

beak color and tail-feather length:

beak color and feather color:

tail-feather length and feather color:

Answer:

Type your answer here.

(Score for Question 2: Click or tap here to enter text. of 2 points)

2. Which two alleles are the farthest apart?

Answer:

Type your answer here

(Score for Question 3: Click or tap here to enter text. of 2 points)

3. Which two alleles are the closest together?

Answer:

Type your answer here.

(Score for Question 4: Click or tap here to enter text. of 2 points)

4. True or False: The diagram shows the correct genetic map for these three alleles on one chromosome.


Answer:

Type your answer here.

© Stride, Inc. All rights reserved. No reproduction without written consent of Stride, Inc.Page 2 of 3


Answer: List the distances between each pair of genes.Beak color and tail feat...

Lab Report: Genetic Crosses 1

You may wish to construct the Punnett squares on scratch paper first before you fill in the Punnett squares on the Lab Report. Answer the questions below. When you are finished, submit this assignment to your teacher by the due date for full credit.

Part 1: Monohybrid Cross—Predicting Freckles in an F1 Generation

Apply your understanding of how alleles assort and combine during reproduction to evaluate a scenario involving a monohybrid cross.

The allele for having freckles (F) is dominant over the allele for not having freckles (f). Some characteristics in people are inherited as simple dominant and recessive traits. One example is freckles. Freckles is a dominant trait, and the lack of freckles is a recessive trait. In this example, a person with freckles is represented as either FF or Ff, and a person with no freckles is represented as ff.

Total score: Click or tap here to enter text. of 20 points

(Score for Question 1: Click or tap here to enter text. of 2 points)

1. Imagine a mother and a father who both have freckles and are heterozygous for the trait, or Ff. They are the P generation, or parent generation. Create a Punnett square to show their offspring, the F1 generation.

Answer:

Type your answer here.Click or tap here to enter text.

Part 1 Punnett Square

Click or tap here to enter text. Click or tap here to enter text.

Click or tap here to enter text. Click or tap here to enter text.

(Score for Question 2: Click or tap here to enter text. of 2 points)

2. Calculate the ratios of the genotypes and phenotypes of the offspring in the F1 generation.

Answer:

Type your answer here.Click or tap here to enter text.

Genotypes:

Phenotypes:

Part 2: Dihybrid Cross—Predicting Flower Color and Seed Shape

Imagine that you are crossing two plants that are heterozygous for flower color and seed shape. The dominant and recessive alleles for these traits are as follows:

purple flowers: P

white flowers: p

round seeds: R

wrinkled seeds: r

(Score for Question 1: Click or tap here to enter text. of 2 points)

3. Determine the genotype of each parent plant and write them below.

Answer:

Type your answer here.Click or tap here to enter text.

Genotype of parent plant 1:

Genotype of parent plant 2:

(Score for Question 2: Click or tap here to enter text. of 4 points)

4. How will the alleles for these traits assort into the gametes that each parent might produce? (Hint: For a reminder on how alleles sort independently into gametes, refer to the illustration in Part 2, Question 2, in the Student Guide.)

Answer:

Type your answer here.Click or tap here to enter text.

Parent plant 1

Gamete 1:

Gamete 2:

Gamete 3:

Gamete 4:

Parent plant 2

Gamete 1:

Gamete 2:

Gamete 3:

Gamete 4:

(Score for Question 3: Click or tap here to enter text. of 4 points)

5. Create a Punnett square to calculate the possible genotypes that can result from a cross between the two parent plants. In a dihybrid cross, the alleles of the gametes of each parent are written along the left side and top of the Punnett square, just as they are for a monohybrid cross. Fill in the squares with the predicted genotypes. Some information has been filled in for you to help you complete a Punnett square for a dihybrid cross.

Answer:

Type your answer here.Click or tap here to enter text.

Part 2 Punnett Square

PPRr

PPRr

ppRR

pprr

(Score for Question 4: Click or tap here to enter text. of 4 points)

6. Look at the Punnett square and list the genotypes that would correspond to each phenotype.

Answer:

Type your answer here.Click or tap here to enter text.

purple flowers, round seeds:

purple flowers, wrinkled seeds:

white flowers, round seeds:

white flowers, wrinkled seeds:

(Score for Question 5: Click or tap here to enter text. of 2 points)

7. Finally, look at the Punnett square again and write the numbers of offspring with each phenotype.

Answer:

Type your answer here.Click or tap here to enter text.

purple flowers, round seeds:

purple flowers, wrinkled seeds:

white flowers, round seeds:

white flowers, wrinkled seeds:

© Stride, Inc. All rights reserved. No reproduction without written consent of Stride, Inc.Page 3 of 3

without K12’s written consent is prohibited.


Answer: Part 1 Punnett Square:| F | f---|-----|---f | Ff | fff | Ff | ffGenoty...
Answer: If y = x^2 - 4x + 4 and 2x - y = 1, then replace y = x^2 - 4x + 4 with...
Answer: From this information, we know that the quadratic function has a verte...
Answer: C) y = -3x - 6
Answer: It refers to a chemical reaction in which a 16e metal hydride acts as ...
Answer: One way children's language production reflects the language world is ...
Answer: Transcribe the adult production of the word IPA.a) Tent: [tɛnt]b) Hand...
Answer: P0 = D / (r - g) where:P0 is the current stock priceD is the dividendr...
Answer: In this case the composite function is f(u,v) = u + v + uv^2 and u = e...
Answer: Drawing conclusions based on subjective, holistic perceptions is unsci...
Answer: Solving for x gives: 2x - 3 = 9k-x + 4 = 3k Dividing both sides of the...
Answer: A. To calculate the flow rate in ml/h, the total volume of solution (2...

Weekly leaderboard

Start filling in the gaps now
Log in