BUAD 310g Chapter Notes - Chapter 15: Contingency Table, Test Statistic, Poisson Distribution

10 Dec 2016
School
Department
Course
Professor
Document Summary
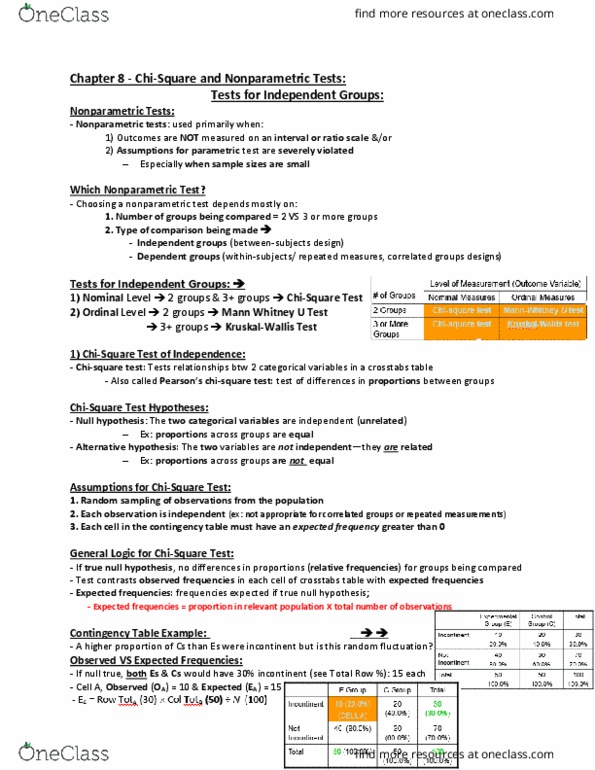
Each cell shows the count of observations that fall into the category defined by its row. Requires no assumptions about the shape of the populations from which the samples. We summarize by tallying response frequencies on a table that we call a contingency table. Contingency table: a cross-tabulation of n paired observations into categories and column heading. To test hypotheses, we use the chi-square test for independence. Chi-square test for independence is called a distribution-free test are drawn. Compare the observed frequency in which cell of the contingency table with the expected frequency. Chi-square test statistic measures the relative difference between expected and observed frequencies. ***if two variables are independent, then should lead to a chi-square test statistic near zero. Chi-square test statistic cannot be negative so it is always a right-tailed test. Test statistic is compared with a critical value from the chi-square probability distribution.