BUAD 310g Chapter Notes - Chapter 3: Exploratory Data Analysis, Frequency Distribution, Bar Chart

25 Nov 2016
School
Department
Course
Professor
Document Summary
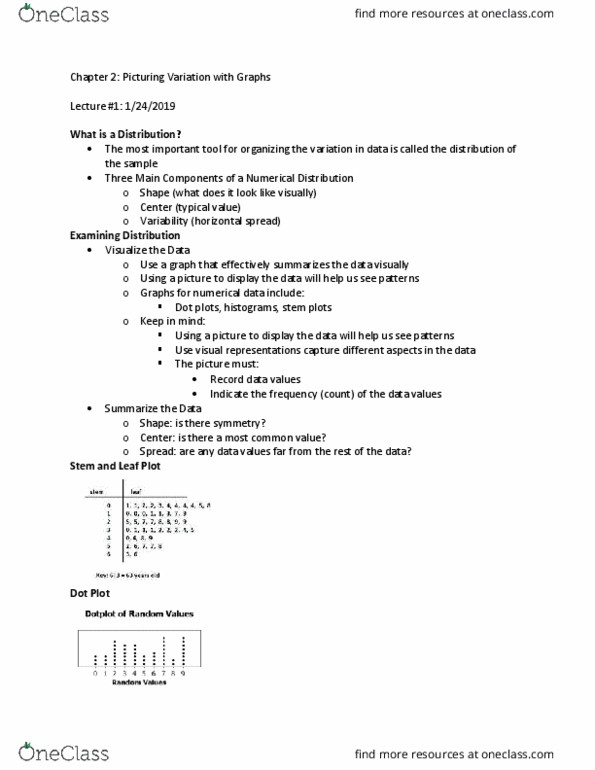
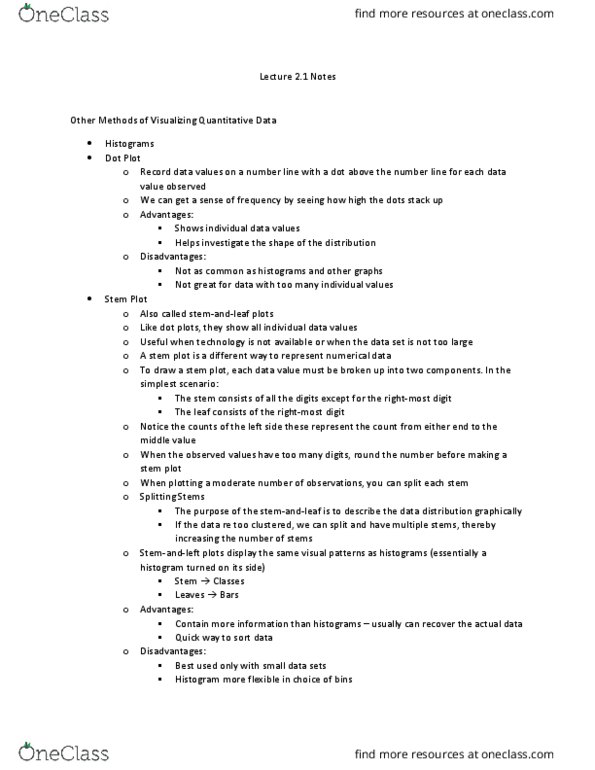
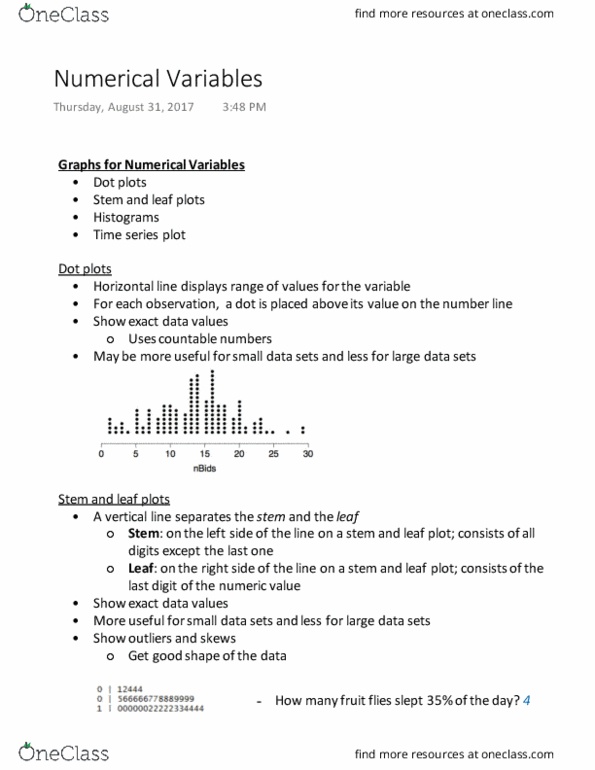
Discussed in terms of 3 characteristics: center, variability, shape. Statistics can summarize data in a visual or numerical way. Analysts often prefer a visual display of data. Type of graph dependent on type of data. Can reveal central tendency as well as dispersion. Helpful with small samples of integer data with a limited range (can get awkward with decimals) Rarely seen in business presentations but useful tool for quick tabulation of small data sets. Simple display of individual values of numerical data. Steps: create scale that covers data range, mark axis demarcations and label them, dot each data point above its corresponding value, stacking vertically if there are more than one pieces of data of the same value. Shows center (easily see where data tends to cluster) Can show shape if sample is large enough. (literally just dot plots stacked vertically for comparison)