Statistical Sciences 1024A/B Chapter Notes - Chapter 22: Confidence Interval, Sampling Distribution, Statistical Parameter

20 Apr 2017
School
Department
Professor
Document Summary
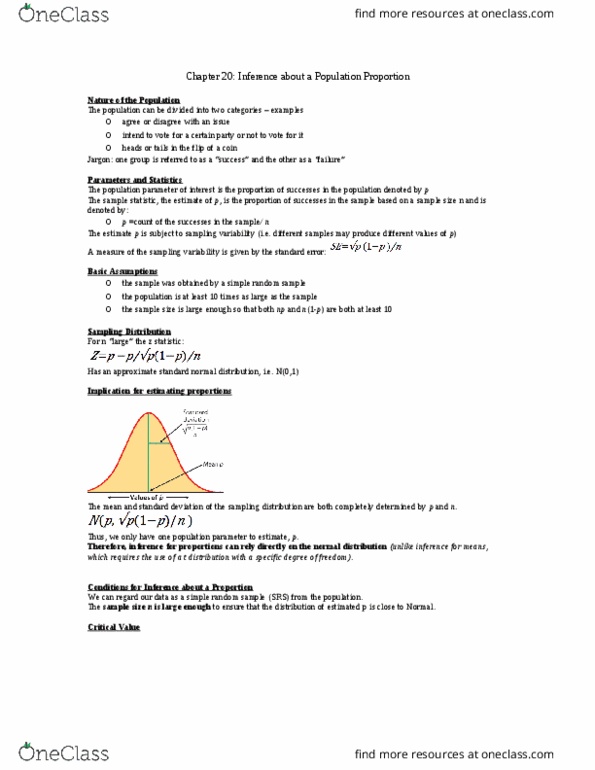
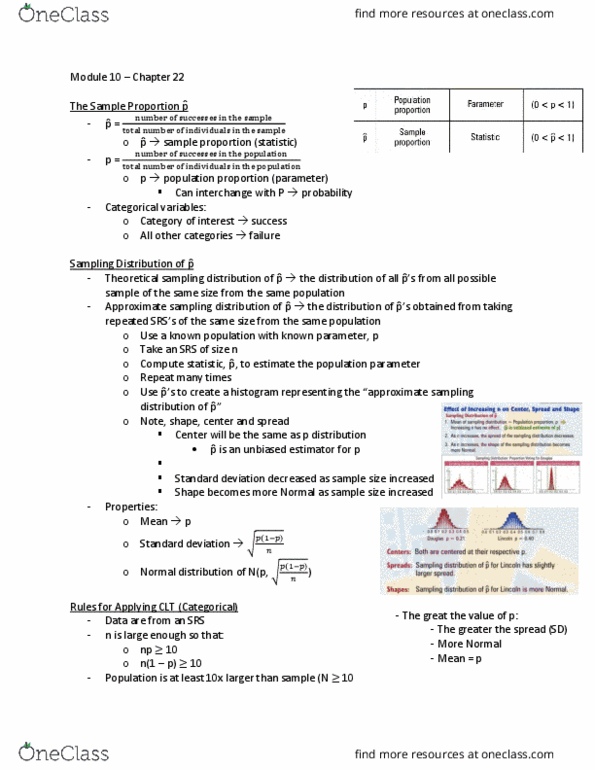
The sample statistic, , estimates the population proportion and is the proportion of successes in the sample based on a sample of size n. Draw an srs of size n from a large population that contains proportion p successes. Let be the sample proportion of successes. Then: as the sample size increases, the sampling distribution of becomes approximately. Normal: the mean of the sampling distribution is p, the standard deviation of the sampling distribution is. The mean and standard deviation (width) of the sampling distribution are both completely determined by p and n. thus we have only one population parameter to estimate, p. Therefore, inference for proportions can rely directly on the normal distibution (unlike inference for mean, hich requires the use of a t distibution with a specific degreee of freedom). An approximate level c confidence interval for p is, where z* is the critical value for the standard normal density curve with area c z*.