Statistical Sciences 1024A/B Lecture Notes - Lecture 20: Normal Distribution, Simple Random Sample, Confidence Interval

14 May 2016
School
Department
Professor
Document Summary
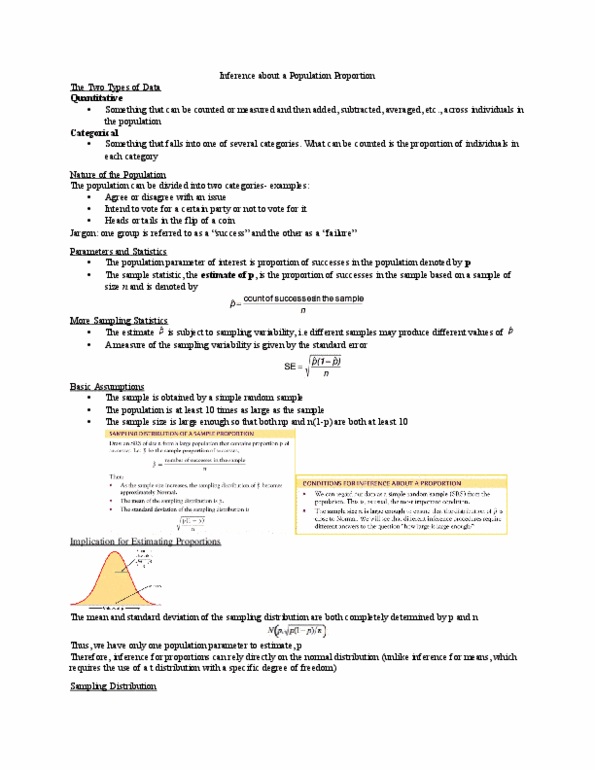
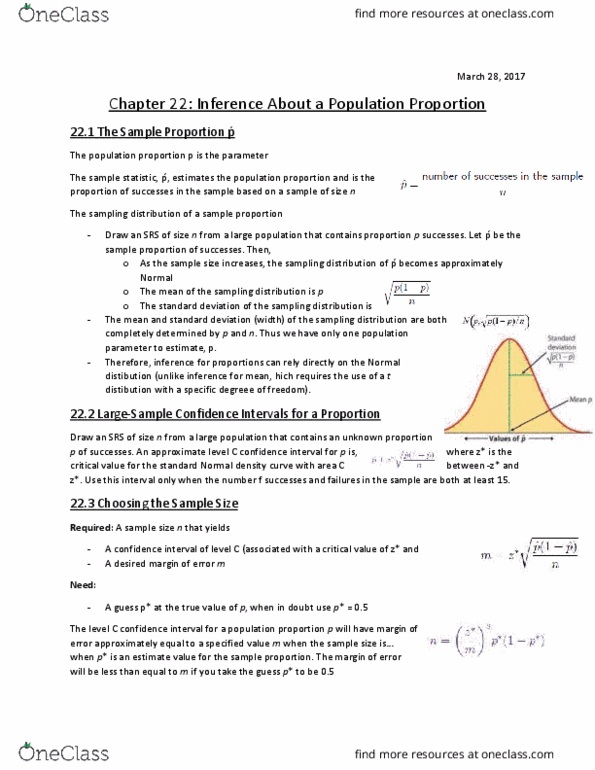
The population can be divided into two categories examples: agree or disagree with an issue, intend to vote for a certain party or not to vote for it, heads or tails in the flip of a coin. Jargon: one group is referred to as a success and the other as a failure . The population parameter of interest is the proportion of successes in the population denoted by p. The sample statistic, the estimate of p, is the proportion of successes in the sample based on a sample size n and is denoted by: p =count of the successes in the sample/ n. The estimate p is subject to sampling variability (i. e. different samples may produce different values of p) A measure of the sampling variability is given by the standard error: Has an approximate standard normal distribution, i. e. n(0,1) The mean and standard deviation of the sampling distribution are both completely determined by p and n.