Statistical Sciences 1024A/B Chapter Notes - Chapter 4-5: Dependent And Independent Variables, Scatter Plot

2 Feb 2017
School
Department
Professor
Document Summary
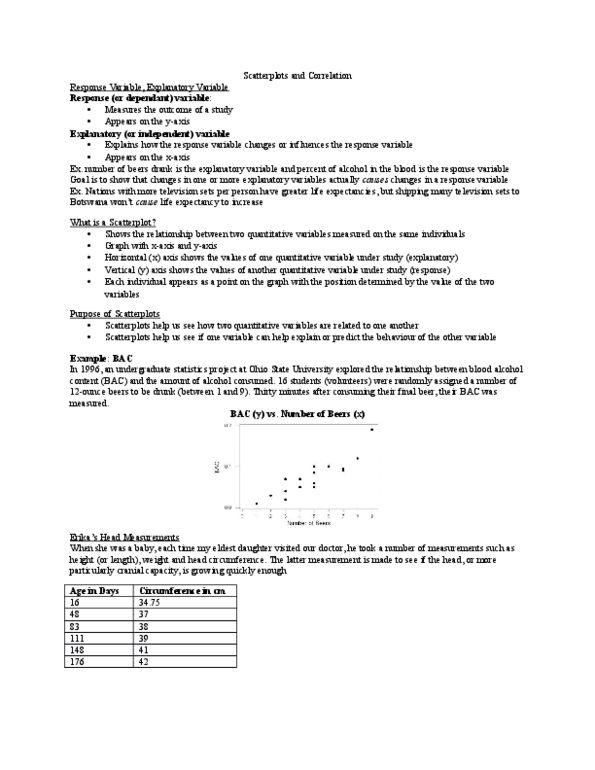
Explanatory variable = explains or in uences changes in response variable. Explanatory variable on x-axis & response variable on y-axis. Assessing how much scatter data points are close or spread out. Positive association: above average values & below average values tend to occur together. Negative association: above average values occur w below average values & vice versa. Weak: scatterplot highly variable about trend line & no association if line horizontal. Adding categorical variable to scatterplot: legend price by weight with or without gold nish. Correlation: scatterplot displays strength, direction & form of relationship b/t 2 variables. R, measures strength of linear relationship b/t 2 quantitative variables. Correlation r b/t x & y = Properties of correlation: makes no distinction b/t explanatory & response variables. R has no units & doesn"t change when we change units of measurement in x & y. Correlation r is always number b/t -1 and 1.