Statistical Sciences 1024A/B Lecture Notes - Lecture 4: Scatter Plot, Brain Size, Dependent And Independent Variables

20 Apr 2016
School
Department
Professor
Document Summary
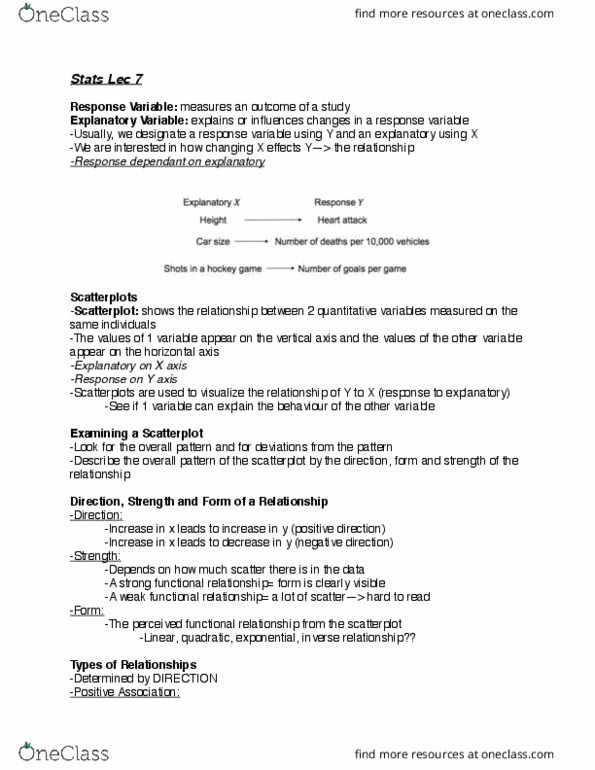
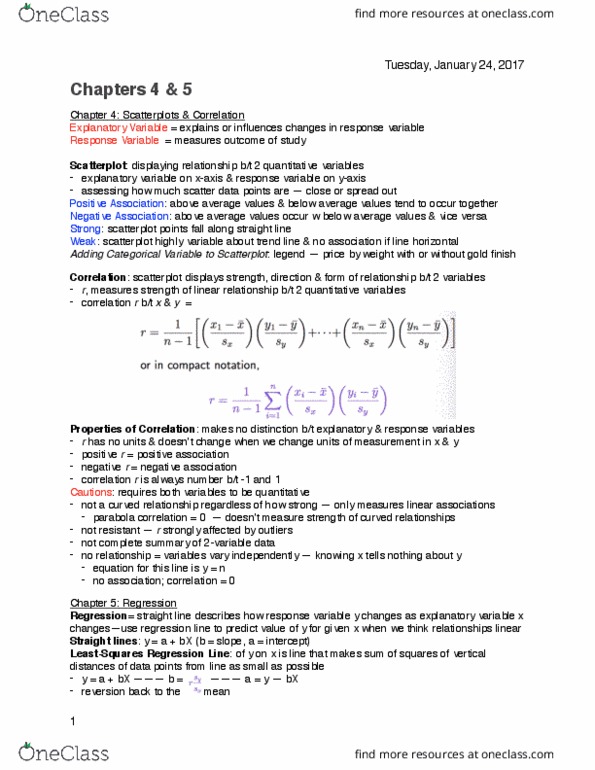
Explains how the response variable changes or influences the response variable. Ex. number of beers drank is the explanatory variable and percent of alcohol in the blood is the response variable. Goal is to show that changes in one or more explanatory variables actually causes changes in a response variable. Nations with more television sets per person have greater life expectancies, but shipping many television sets to. Shows the relationship between two quantitative variables measured on the same individuals. Horizontal (x) axis shows the values of one quantitative variable under study (explanatory) Vertical (y) axis shows the values of another quantitative variable under study (response) Each individual appears as a point on the graph with the position determined by the value of the two variables. Scatterplots help us see how two quantitative variables are related to one another. Scatterplots help us see if one variable can help explain or predict the behaviour of the other variable.