Health Sciences 2801A/B Chapter Notes - Chapter 3: Scatter Plot, Dependent And Independent Variables

19 Oct 2017
School
Department
Course
Professor
Document Summary
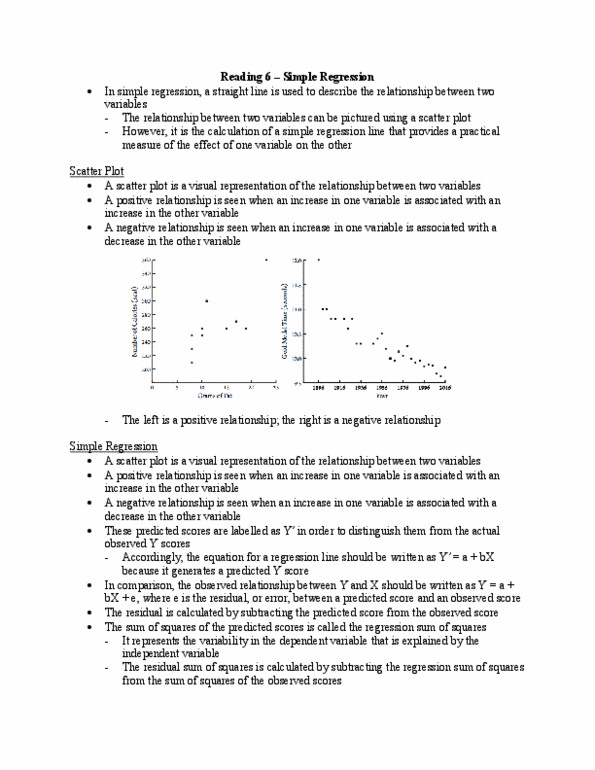
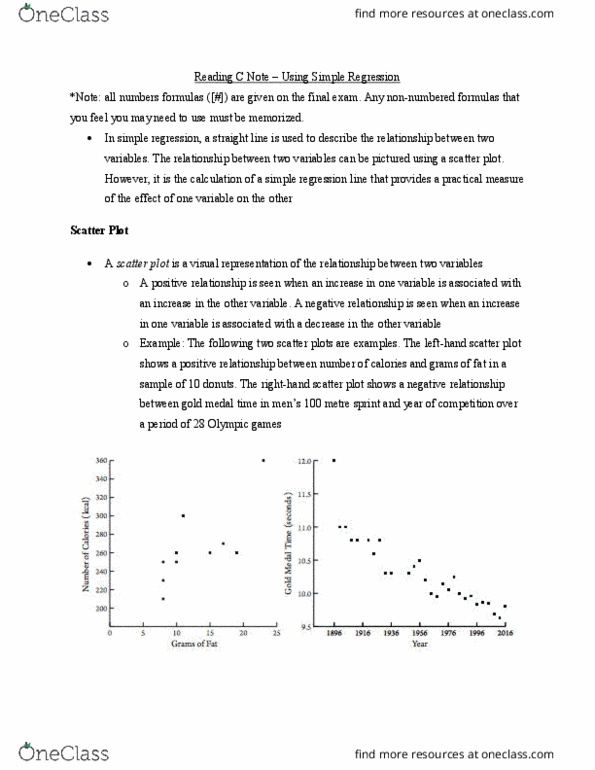
Simple regression a straight line that is used to describe the relationship between two variables. The relationships b/w two variables are represented by a scatter plot, while the calculation of simple regression provides a practical measure of the relationship between two variables (effect of x on y) Scatter plot visual representation of the relationship between two variables. When an increase in the independent variable is associated with an increase in the dependent variable, this is a positive relationship. When an increase in the independent variable is associated with a decrease in the dependent variable or vice versa, this is a negative relationship. A straight line of fit represents the relationship b/w the two variables and is represented by. A is the constant and can be calculated by. B is the slope and can be calculated by. The predicted scores from the independent variable are labelled as y" to distinguish them from the observed scores which are labelled as y.