Health Sciences 2801A/B Chapter Notes - Chapter 6: Scatter Plot, Standard Deviation, Kilogram

26 Dec 2016
School
Department
Course
Professor
Document Summary
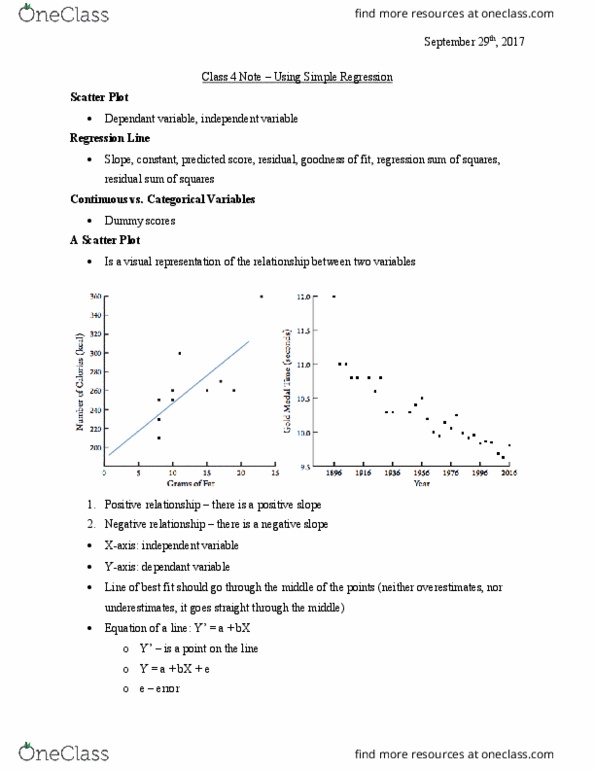
In simple regression, a straight line is used to describe the relationship between two variables. The relationship between two variables can be pictured using a scatter plot. However, it is the calculation of a simple regression line that provides a practical measure of the effect of one variable on the other. The left is a positive relationship; the right is a negative relationship. A scatter plot is a visual representation of the relationship between two variables. A positive relationship is seen when an increase in one variable is associated with an increase in the other variable. A negative relationship is seen when an increase in one variable is associated with a decrease in the other variable. These predicted scores are labelled as y in order to distinguish them from the actual observed y scores. Accordingly, the equation for a regression line should be written as y = a + bx because it generates a predicted y score.