STAB22H3 Chapter Notes - Chapter 3: Categorical Variable, Frequency Distribution, Bar Chart


38
STAB22H3 Full Course Notes
Verified Note
38 documents
Document Summary
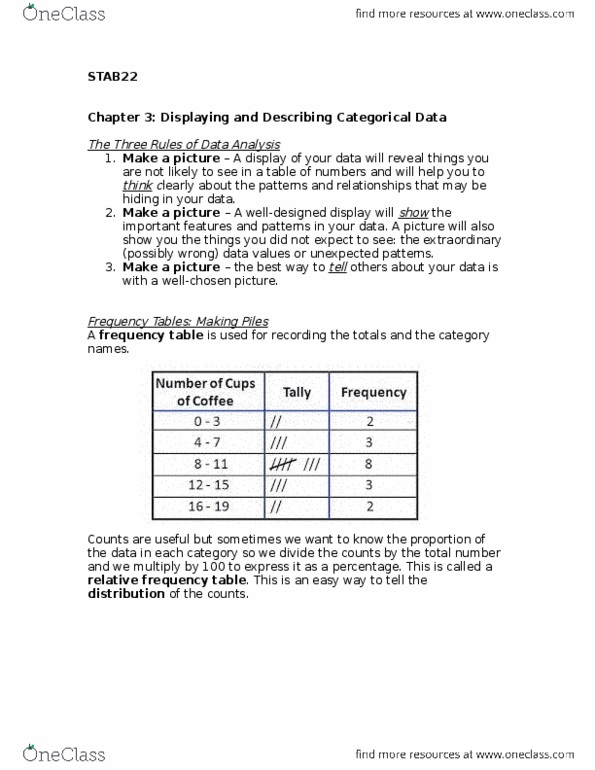
Pile together things that go together, so we can see how cases distribute across different categories. For categorical data, just count the number of cases corresponding to each category and pile them up. Frequency table- records the totals and the category name. The counts in each category is divided by the total and then multiplied by 100. Both tables describe the distribution of a categorical variable because they name the possible categories and tell how frequently each occurs. Area principle: says that the area occupied by a part of the graph should correspond to the magnitude of the value it represents. Bar charts: display the distribution of a categorical variable, showing the counts for each category next to each other for easy comparison. Each bar should have small spaces between them to show that they are free standing bars that could be rearranged into any order. The bars are lined up along a common base.