GGR276H5 Chapter Notes - Chapter 3: Cumulative Frequency Analysis, Frequency Distribution, Unimodality


(3.1-3.3)
The mode is simply the value that occurs most frequently in a set of ungrouped
data.
With ordinal or interval-ratio data grouped into classes, the category with the
largest number of observations is defined as the modal class.
The midpoint of the modal class interval is the crude mode.
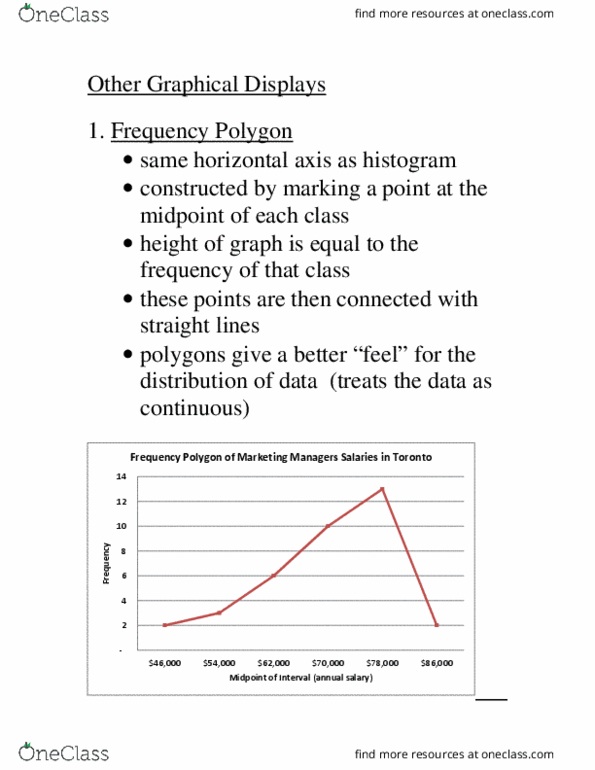
This is an appropriate time to introduce some graphics that are often associated
with grouped data: (1) the histogram (relative frequency histogram) and related
frequency polygon, and (2) ogive (cumulative frequency distribution).
Another useful method for displaying data in a relative frequency format is a
cumulative frequency diagram, or ogive (figure 3.2).
The median is the middle value from a set of ranked observations and is therefore
the value with an equal number of data units both above it and below it.
The mean (also called the arithmetic mean or the average) is the most widely used
measure of central tendency.
Whatever the specific circumstance, a weighted mean is calculated from only the
class intervals and class frequencies presented in table 3.2 and figure 3.1, using this
formula:
To permit this calculation, two related assumptions are made about the distribution
of values within each category or class interval: (1) without any information to the
contrary, one assumes the data are evenly distributed within each class interval;
therefore, (2) the best summary representation of the values in each interval is the
class midpoint.
If a distribution is unimodal (having a single distinct mode) and symmetric (evenly
balanced around a single distinct mode or central vertical line), then all three
centers are likely to be similarly located and no advantage accrues to any statistic
(figure 3.3, case 1).
If a frequency distribution is bimodal (having two distinct modes) or multimodal
(with more than two modes), the mean may be located on the distribution at a place
that would not be considered typical.
If a frequency distribution contains one or more extreme or atypical values
(outliers) the mean is heavily influenced by these values and its effectiveness as a
measure of centrality may be reduced.
find more resources at oneclass.com
find more resources at oneclass.com
Document Summary
The mode is simply the value that occurs most frequently in a set of ungrouped data. With ordinal or interval-ratio data grouped into classes, the category with the largest number of observations is defined as the modal class. The midpoint of the modal class interval is the crude mode. This is an appropriate time to introduce some graphics that are often associated with grouped data: (1) the histogram (relative frequency histogram) and related frequency polygon, and (2) ogive (cumulative frequency distribution). Another useful method for displaying data in a relative frequency format is a cumulative frequency diagram, or ogive (figure 3. 2). The median is the middle value from a set of ranked observations and is therefore the value with an equal number of data units both above it and below it. The mean (also called the arithmetic mean or the average) is the most widely used measure of central tendency.