QMS 102 Lecture Notes - Lecture 1: Cumulative Frequency Analysis, Interquartile Range, Pie Chart

29 Oct 2018
School
Department
Course
Professor
Document Summary
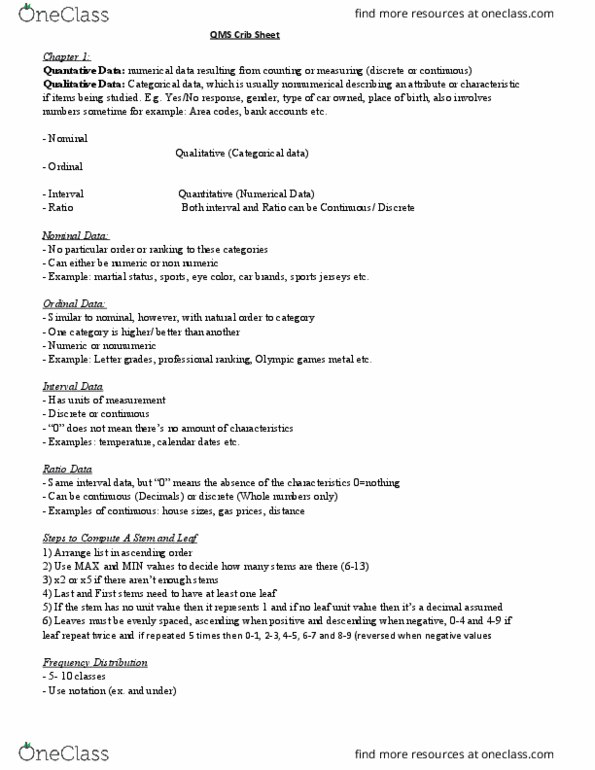
Data classification (1) quantitative/numerical data: result of measuring, classified either discrete/continuous (1) discrete: expressed as whole numbers, +/- (2) continuous: expressed as non-integer, +/- (2) qualitative data: describe an attribute of item, non-numeric or numeric. 6 to 13 stems | stems must be consecutive or repeated (2 or 5 times) | 1 stem (leaf = 0 - 9) | 2. Crf or c% is on vertical axis, upper boundary of class is on horizontal axis. Weighted mean example 3 is the frequency distribution. For the x values, use the midpoint for each class. Sample mean: (x bar) population mean: ex/n. Range (r) highest lowest sample variance: s^2 (std dev ^2) population variance: ^2 interquartile range (iqr) iqr = q3 q1 standard deviation s(x)= x - mean of x/n (n-1) sample population std dev: (x) Sample cv = standard deviation (s)/x x100 population cv= / x100 .