STAT 100 Chapter Notes - Chapter 15: Dependent And Independent Variables

14 Oct 2014
School
Department
Course
Professor


8
STAT 100 Full Course Notes
Verified Note
8 documents
Document Summary
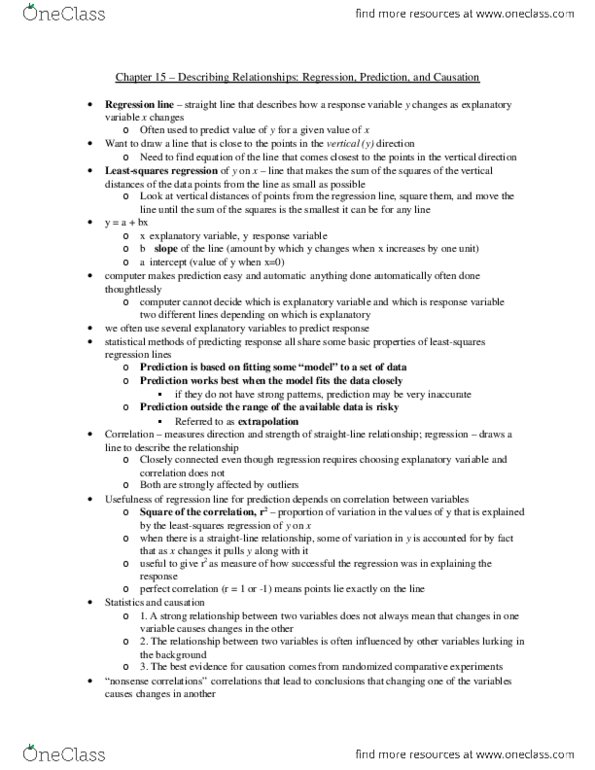
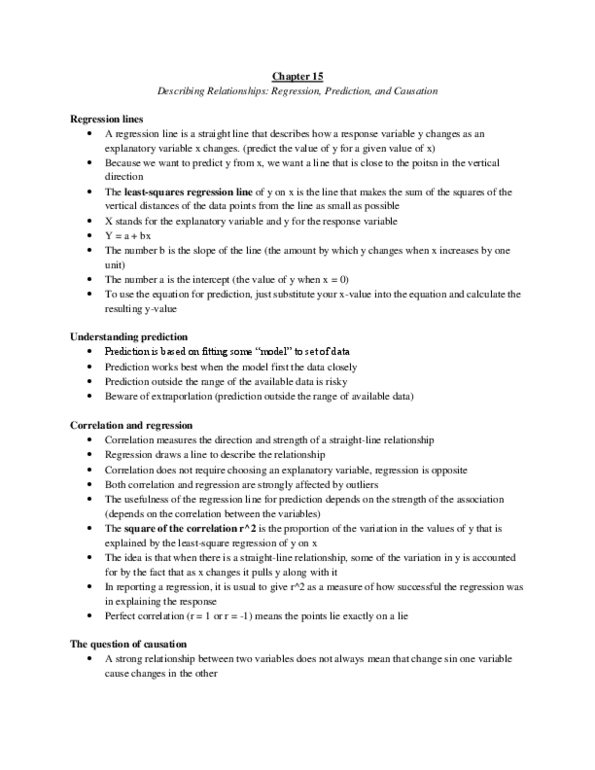
A regression line is a straight line that describes how a response variable y changes as an explanatory variable x changes. We often use a regression line to predict the value of y for a given value of x. Regression is the name for statistical methods that fit some model to data in order to predict a response variable from one or more explanatory variables. The least-squares regression line of y on x is the line that makes the sum of the squares of the vertical distances of the data points from the line as small as possible. y=a+bx. Prediction outside the range of available data is referred to as extrapolation. The square of the correlation, r2, is the proportion of the variation in the values of y that is explained by the least-squares regression of y on x. A strong relationship between two variables does not always mean that changes in one variable cause changes in the other.