STAT 100 Lecture Notes - Lecture 89: Scatter Plot, Dependent And Independent Variables, Low-Density Lipoprotein

30 Nov 2017
School
Department
Course
Professor


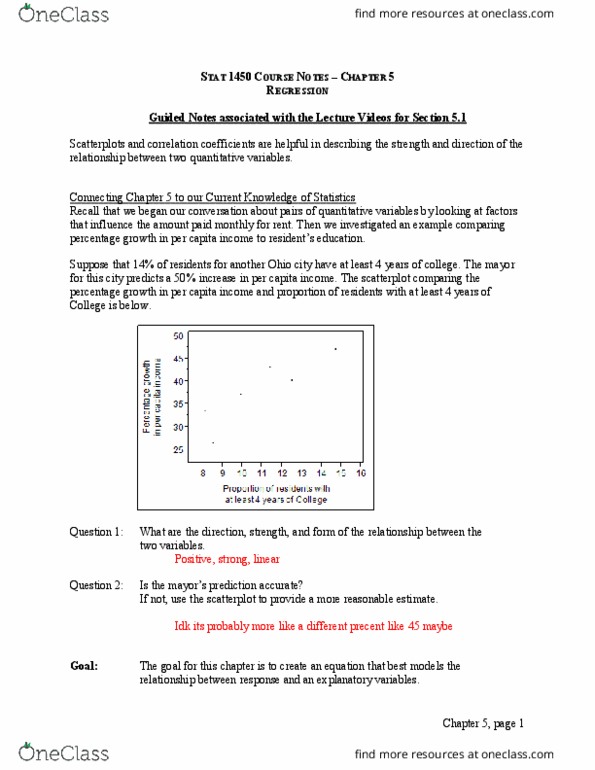
8
STAT 100 Full Course Notes
Verified Note
8 documents
Document Summary
Regression, prediction and causation: example 1: could we predict or explain a state"s democratic vote. % in the 2008 election based on its democratic vote % in the 2004 election: scatterplot shows a positive linear association between 2004. Democratic vote percentage and 2008 democratic vote percentage: example 2: long term study of families measures two variables for each family: the father"s cholesterol level at age 50, and the son"s cholesterol level at age 50. Figure 1: scatterplot: 2004 democratic percentage on horizontal axis, 2008 democratic percent- age on vertical axis. 4 e g a t n e c r e p c i t a r c o m e. Figure 2: scatterplot: 2004 democratic percentage on horizontal axis, 2008 democratic percent- age on vertical axis, with regression line included. 15. 3): statistical software can give us the equation of the least squares regression line.