QMS 102 Chapter Notes - Chapter 4: Weighted Arithmetic Mean, Interquartile Range, Variance

21 Feb 2016
School
Department
Course
Professor
Document Summary
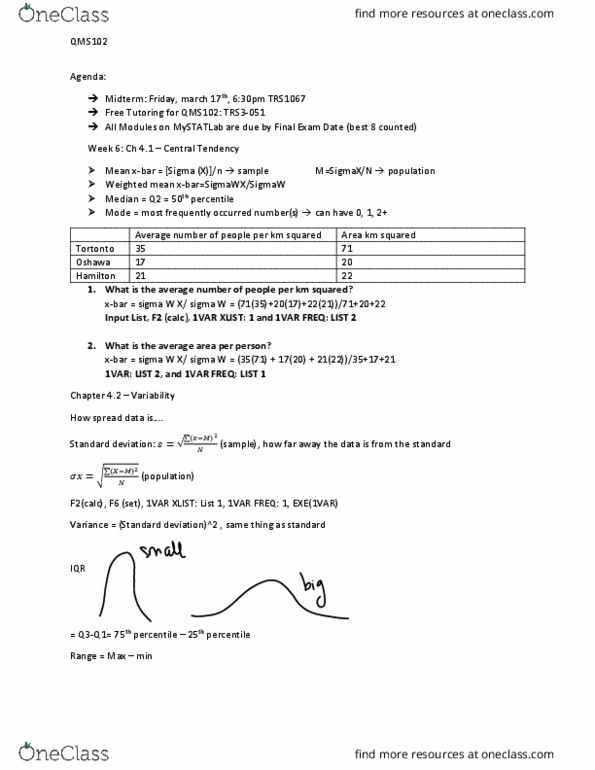
The middle number when all the data is ordered i=n+1 2 ) position of the median [n=number of data] Calculator method to obtain the average of weighted. Provides the mean, median, and standard deviation: from the main menu, select the stat mode. 13. set the following: 1 var x list: list 1, 1 var freq : 1. Ox = the value of population standard deviation. The number that appears the most frequent: could be no mode or 1 mode or many modes. The maximum value subtracted by the minimum values. For sample variance, square the sample standard deviation. For population variation, square the population standard deviation. Five number summary: minimum value, first quartile (q1, median (q2, third quartile (q3, maximum value. It goes from left to right: left outer fence 2. The more spread out, or dispersed, the data are the larger the range, iqr, variance, standard deviance. The more concentrated, or homogeneous the data are, the smaller the range,