PSYC 200 Study Guide - Midterm Guide: Mutual Exclusivity, Binomial Distribution, Normal Distribution

22 Apr 2016
School
Department
Course
Professor
Document Summary
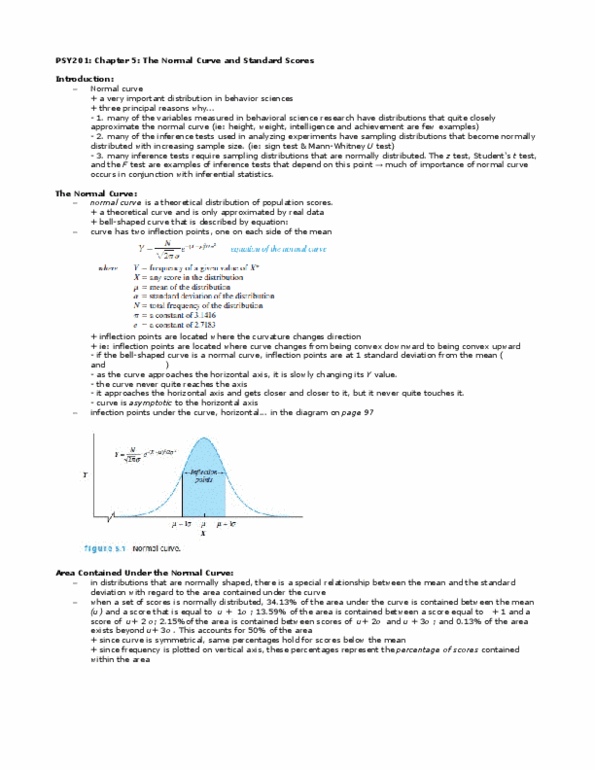
Chapter 5. 1-5. 2 the normal curve and standard scores 10/17. The normal curve is a very important distribution in the behavioral sciences. Many of the variables measured in behavioral science research have distributions that quite closely approximate the normal curve (height, weight, intelligence, Many of the inference tests used in analyzing experiments have sampling distributions that become normally distributed with increasing sample size. ( sign test. Many inference tests require sampling distributions that are normally distributed. (the z test, and the f test. Normal curve- theoretical distribution of population scores, bell shaped. pi= 3. 1416 e= 2. 7183. Y= frequency of a given value of x* Z- score- is a transformed score that designates how many standard deviation units the corresponding raw score is above or below the mean. The mean of z-scores = zero and the standard deviation = 1. Z-scores and raw data have the same shape.