POLS 3650 Chapter Notes - Chapter 7: Contingency Table, Estimation Theory, Test Statistic

4 Feb 2017
School
Department
Course
Professor

Document Summary
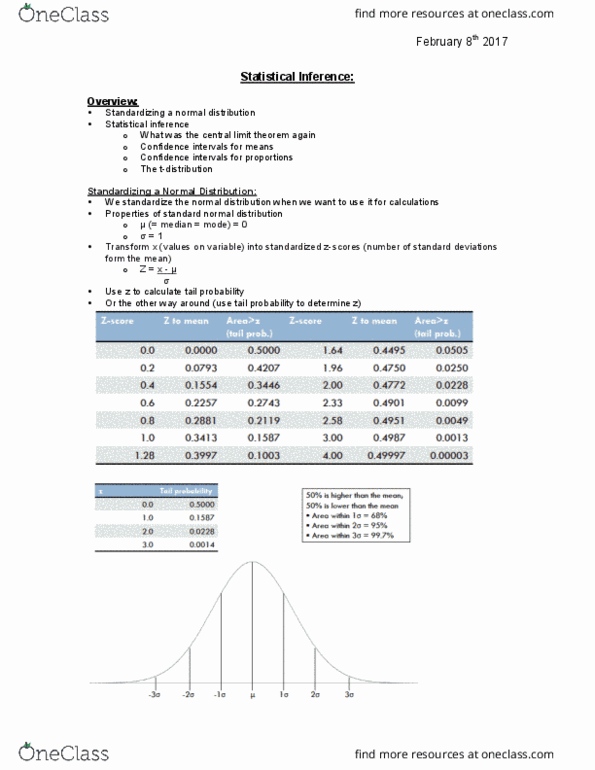
Chapter 7: the normal curve and sampling distributions page #104-126: statistical inference the process of using sample data to estimate unknown population parameters and to test statistical hypothesis. It is also called the standard normal probability distribution, or more simply, the normal curve. When a variable is distributed, it has many well- defined properties (it is symmetrical around its mean, bell-shaped, and unimodal, and a constant proportion of cases fall within given standard deviations from the mean). For example, for a normal distribution, 34. 13% of the cases will always fall between the mean and 1 standard deviation above the mean. Z-scores as standard scores: a z-score reflects the number of standard deviations from the mean, z-score a standardized score that converts a distribution to have a mean of 0 and a standard deviation of 1. Z-scores are also called normal deviates to designate their use for normal distributions. Raw scores are converted to z-scores by their following.