Health Sciences 2801A/B Study Guide - Final Guide: Scatter Plot

23 Dec 2017
School
Department
Course
Professor
Document Summary
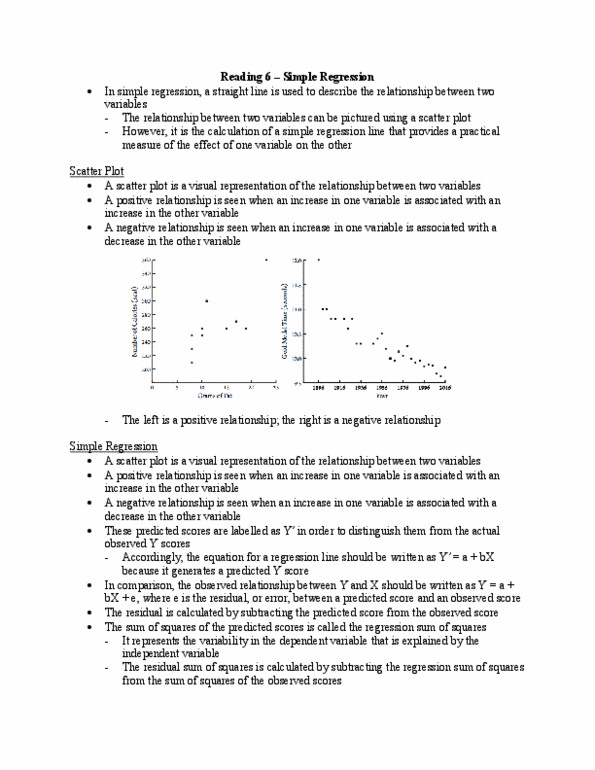
Simple regression a straight line that is used to describe the relationship between two variables. Scatter plot visual representation of the relationship between two variables. The constant. y = + bx straight line of fit. Regression sum of squares represents the variability in the dependent variable that is explained by the independent variable. Residual sum of squares represents the variability in the dependent variable that is not explained by the independent variable. Standardized slope expresses the effect of an independent variable using a z score as. Standardized slope expresses the effect of an independent variable using a z score as opposed to original units of measurement. Dummy coding a method used to represent a categorical variable using numbers 1 & 0. Target category scores are assigned a value of 1 on the independent variable. Reference category scores are assigned a value of 0. Categorical independent variable represents different types of things. Continuous independent variable represents different amounts of things.