1
answer
0
watching
80
views
18 Jul 2019
Question - What are the key financial indicators that shows that Jackson Automotive will not be able to pay back the loan at the end of the fiscal year?
Background Jackson had requested the renewal of an existing term loan with the bank in the amount of $5 million that was originally scheduled to be repaid at the end of the month. Jackson was also seeking to borrow an additional $2.4 million to fund the acquisition of a long-needed piece of equipment, which it planned to purchase in late July. Both loans, which totaled $7.4 million, would be repayable on September 30, 2013.
Data -
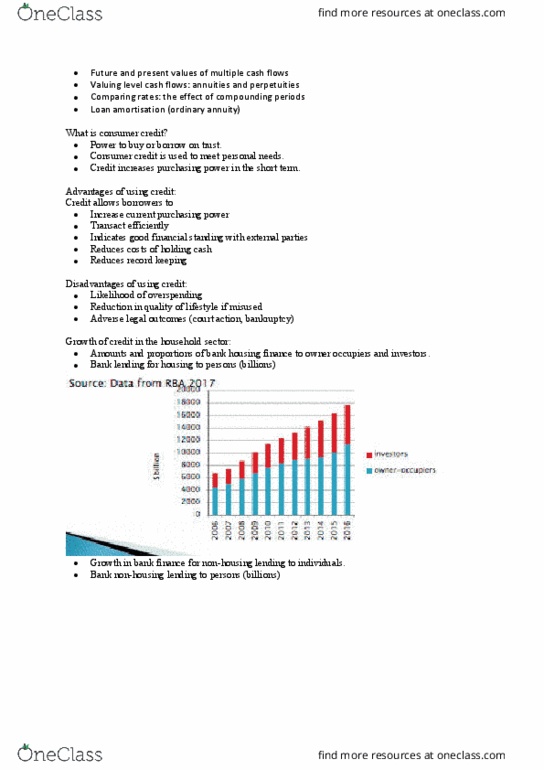
Exhibit 1 - Forecast Balance Sheets, Fiscal Year 2013 (thousands of dollars) 2013 2013 Forecast May June July August September Cash 4,994 2,720 10,796 6,532 (1,372) Accounts receivablea 3,744 10,881 6,474 7,201 7,394 Inventory 12,163 7,482 6,936 6,524 5,963 Current assets 20,901 21,082 24,206 20,257 11,985 Gross PP&E 45,500 45,500 45,500 47,900 47,900 Accumulated depreciationb 31,448 31,568 31,688 31,818 31,948 Net PP&E 14,052 13,932 13,812 16,082 15,952 Prepaid expenses 54 54 54 54 54 Total assets 35,007 35,068 38,072 36,393 27,991 Accounts payablec 5,950 5,950 5,950 5,950 5,950 Notes payable, bank 5,000 5,000 7,400 7,400 - Accrued taxesd 273 548 799 1,034 906 Other accrued expenses 1,142 1,142 1,142 1,142 1,142 Customer advance payments 2,700 900 - - - Current liabilities 15,065 13,540 15,291 15,526 7,998 Shareholders equity 19,923 21,186 21,672 22,128 21,408 Total liabilities and equity 34,988 34,726 36,963 37,654 29,405 aSelling term of net 30 days bDepreciation of $120,000 per month through July 2013, $130,000 per month as of August 2013 cPurchase terms of net 30 days dTaxes payable for 2013 were assumed to be $1,500,000 and would be paid on December 15, 2012, March 15, 2013, June 15, 2013 and September 15, 2013 in equal increments. Cash Calculation (342) (1,108) 1,261 1,414
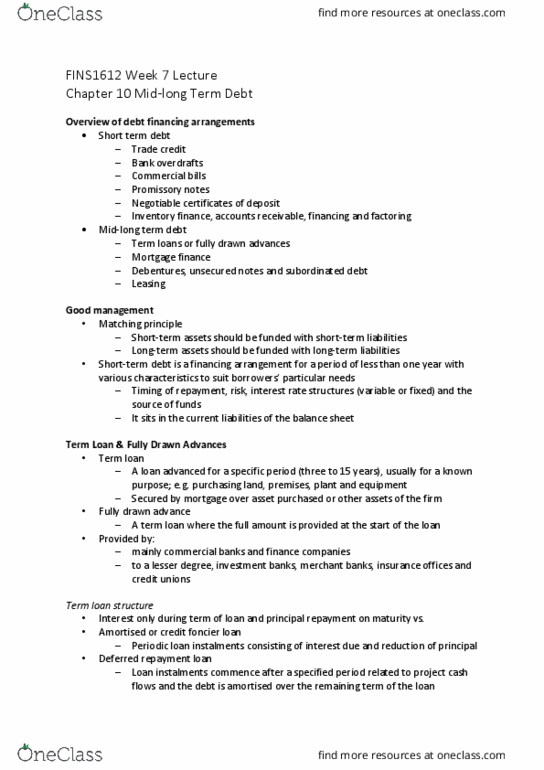
Exhibit 2 - Forecast Income Statements, Fiscal Year 2013 (thousands of dollars) FY 2013 Eight Months Ended May Forecast 2013 June Forecast 2013 July Forecast 2013 August Forecast 2013 September Forecast FY 2013 Twelve Months Ended June Net sales 44,014 12,681 7,374 7,201 7,394 78,664 COGS 34,297 9,881 5,746 5,611 5,762 61,297 Gross Profit 9,717 2,800 1,628 1,590 1,632 17,367 Operating expenses 5,608 750 750 750 750 8,608 Depreciation and amortization 960 120 120 130 130 1,460 Interest expensea 200 25 25 37 37 324 Interest incomeb 60 8 5 18 11 102 Profit (loss) before tax 3,009 1,913 737 691 726 7,076 Income taxesc 1,023 650 251 235 247 2,406 Net income (loss) 1,986 1,263 487 456 479 4,671 Dividends 400 1,200 a6% annualized interest rate charged on outstanding bank loans. b2% annualized rate of return on beginning monthly cash balances. cThe federal tax rate on all earnings was 34%. FYI % COGS to Net sales 77.9% 77.9% 77.9% 77.9% 77.9% 77.9%
Question - What are the key financial indicators that shows that Jackson Automotive will not be able to pay back the loan at the end of the fiscal year?
Background Jackson had requested the renewal of an existing term loan with the bank in the amount of $5 million that was originally scheduled to be repaid at the end of the month. Jackson was also seeking to borrow an additional $2.4 million to fund the acquisition of a long-needed piece of equipment, which it planned to purchase in late July. Both loans, which totaled $7.4 million, would be repayable on September 30, 2013.
Data -
| Exhibit 1 - Forecast Balance Sheets, Fiscal Year 2013 (thousands of dollars) | |||||
| 2013 | 2013 Forecast | ||||
| May | June | July | August | September | |
| Cash | 4,994 | 2,720 | 10,796 | 6,532 | (1,372) |
| Accounts receivablea | 3,744 | 10,881 | 6,474 | 7,201 | 7,394 |
| Inventory | 12,163 | 7,482 | 6,936 | 6,524 | 5,963 |
| Current assets | 20,901 | 21,082 | 24,206 | 20,257 | 11,985 |
| Gross PP&E | 45,500 | 45,500 | 45,500 | 47,900 | 47,900 |
| Accumulated depreciationb | 31,448 | 31,568 | 31,688 | 31,818 | 31,948 |
| Net PP&E | 14,052 | 13,932 | 13,812 | 16,082 | 15,952 |
| Prepaid expenses | 54 | 54 | 54 | 54 | 54 |
| Total assets | 35,007 | 35,068 | 38,072 | 36,393 | 27,991 |
| Accounts payablec | 5,950 | 5,950 | 5,950 | 5,950 | 5,950 |
| Notes payable, bank | 5,000 | 5,000 | 7,400 | 7,400 | - |
| Accrued taxesd | 273 | 548 | 799 | 1,034 | 906 |
| Other accrued expenses | 1,142 | 1,142 | 1,142 | 1,142 | 1,142 |
| Customer advance payments | 2,700 | 900 | - | - | - |
| Current liabilities | 15,065 | 13,540 | 15,291 | 15,526 | 7,998 |
| Shareholders equity | 19,923 | 21,186 | 21,672 | 22,128 | 21,408 |
| Total liabilities and equity | 34,988 | 34,726 | 36,963 | 37,654 | 29,405 |
| aSelling term of net 30 days | |||||
| bDepreciation of $120,000 per month through July 2013, $130,000 per month as of August 2013 | |||||
| cPurchase terms of net 30 days | |||||
| dTaxes payable for 2013 were assumed to be $1,500,000 and would be paid on December 15, 2012, March 15, 2013, June 15, 2013 and September 15, 2013 in equal increments. | |||||
| Cash Calculation | (342) | (1,108) | 1,261 | 1,414 | |
| Exhibit 2 - Forecast Income Statements, Fiscal Year 2013 (thousands of dollars) | ||||||
| FY 2013 Eight Months Ended May | Forecast 2013 June | Forecast 2013 July | Forecast 2013 August | Forecast 2013 September | Forecast FY 2013 Twelve Months Ended June | |
| Net sales | 44,014 | 12,681 | 7,374 | 7,201 | 7,394 | 78,664 |
| COGS | 34,297 | 9,881 | 5,746 | 5,611 | 5,762 | 61,297 |
| Gross Profit | 9,717 | 2,800 | 1,628 | 1,590 | 1,632 | 17,367 |
| Operating expenses | 5,608 | 750 | 750 | 750 | 750 | 8,608 |
| Depreciation and amortization | 960 | 120 | 120 | 130 | 130 | 1,460 |
| Interest expensea | 200 | 25 | 25 | 37 | 37 | 324 |
| Interest incomeb | 60 | 8 | 5 | 18 | 11 | 102 |
| Profit (loss) before tax | 3,009 | 1,913 | 737 | 691 | 726 | 7,076 |
| Income taxesc | 1,023 | 650 | 251 | 235 | 247 | 2,406 |
| Net income (loss) | 1,986 | 1,263 | 487 | 456 | 479 | 4,671 |
| Dividends | 400 | 1,200 | ||||
| a6% annualized interest rate charged on outstanding bank loans. | ||||||
| b2% annualized rate of return on beginning monthly cash balances. | ||||||
| cThe federal tax rate on all earnings was 34%. | ||||||
| FYI | ||||||
| % COGS to Net sales | 77.9% | 77.9% | 77.9% | 77.9% | 77.9% | 77.9% |

Irving HeathcoteLv2
20 Jul 2019