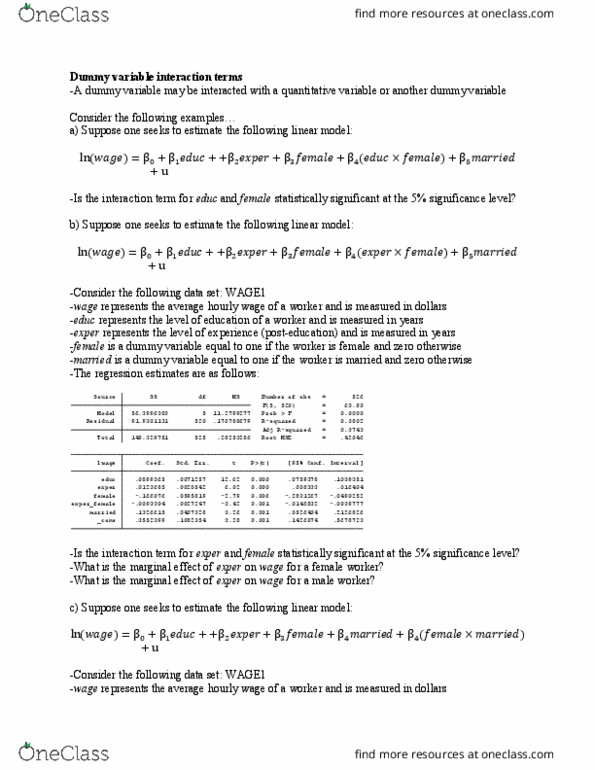
Demand Estimation 1. A multiple regression model, Y = a + bX + cX 2, is estimated by creating a new variable named âX2â that equals X 2 (X square). A computer package produces the following output:
Dependent Variable Y
R Square
F-Ratio
P-Value on F
Observations :27
0.8766
85.25
0.0001
Parameter
standard
Variable
Estimate
Error
T-ratio
P-value
Intercept
8000
3524.0
2.27
0.0325
X
-12.00
4.50
-2.67
0.0135
X2
0.005
0.002
2.5
0.0197
a. Provide the estimated equation. b. Test to see if the estimates of a, b, and c are statistically significant at the 5 percent significance level. c. What is the exact level of significance for a, b, and c? d. What is the fraction of total variation in Y that is explained by the regression equation? e. Is the overall regression equation statistically significant at the 5 percent level? What is the exact level of significance of the equation as a whole? f. If X is equal to 1,200, how much is Y?
Demand Estimation 1. A multiple regression model, Y = a + bX + cX 2, is estimated by creating a new variable named âX2â that equals X 2 (X square). A computer package produces the following output:
| |||||||||||||||||||||||||||||||||||||||
a. Provide the estimated equation. b. Test to see if the estimates of a, b, and c are statistically significant at the 5 percent significance level. c. What is the exact level of significance for a, b, and c? d. What is the fraction of total variation in Y that is explained by the regression equation? e. Is the overall regression equation statistically significant at the 5 percent level? What is the exact level of significance of the equation as a whole? f. If X is equal to 1,200, how much is Y?

Related textbook solutions


Related questions
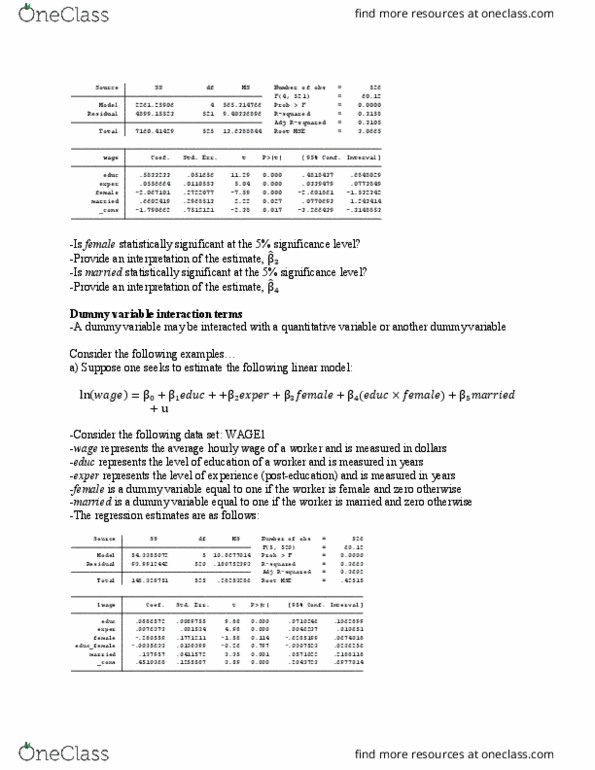
. Suppose Y is related to R and S in the following nonlinear way:
Y= aRáµSá
a. How can this nonlinear equation be transformed into a linear form that can ve analyzed using multiple regression analysis.
Sixty-three observations are used to obtain the following regression results:
| DEPENDENT VARIABLE: LNY | R-SQUARE | F-RATIO | P-VALUE ON F | |
| OBSERVATION: 63 | 0.8151 | 132.22 | 0.0001 | |
| VARIABLE | PARAMETER ESTIMATE | STANDARD ERROR | T-RATIO | P-VALUE |
| INTERCEPT | -1.386 | 0.83 | -1.67 | 0.1002 |
| LNR | 0.452 | 0.175 | 2.58 | 0.0123 |
| LNS | 0.30 | 0.098 | 3.06 | 0.0033 |
b. Test each estimated coefficient for statistical significance at the 5 percent level of significance. What are the exact significance levels for each of the estimated coefficients?
c. Test the overall equation for statistical significance at the 5 percent level of significance. Interpret the p-value of the F-statistic.
d. How well does this nonlinear model fit the data?
e. Using the estimated value of the intercept, compute an estimate of a.
f. If R = 200 and S = 1,500, compute the expected value of Y.
g. What is the estimated elasticity of R? Of S?