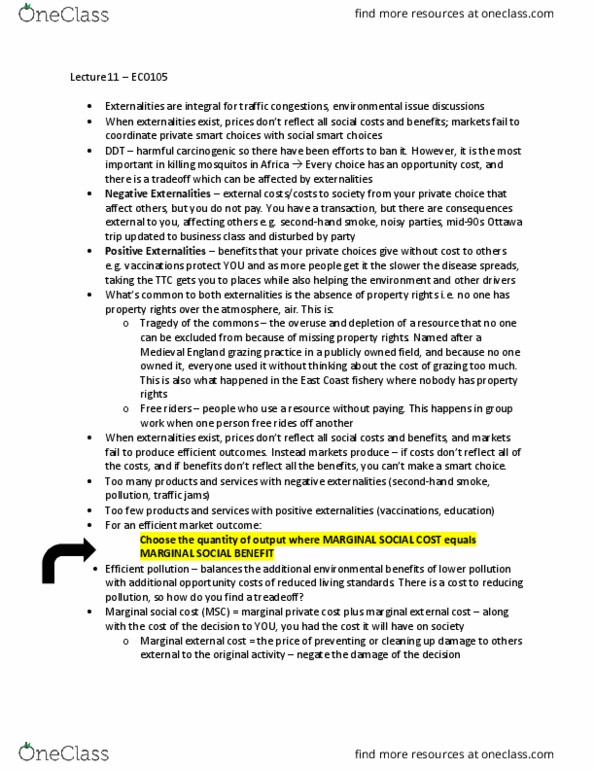
Use the figure below to answer the following question. Price Idollars per kilogram) 12 10 Ssubside MSB>ME MSBCM 2 bread HC 1 2 3 4 5 Quanhaty billions of kilograms per year) Figure 3 19) Refer to Figure 3. The graph shows the market for tomatoes. When the government introduces a subsidy for tomatoes at S4 a kilogram, the quantity produced is because A7 efficient; marginal social cost is less than marginal social benefit B) inefficient; marginal social cost is less than marginal social benefit inefficient; marginal social benefit is less than marginal social cost D) inefficient, marginal social cost is zero E) efficient, marginal social benefit equals marginal social cost


Related textbook solutions


Related questions
The table presents the weekly demand and supply schedule for lawnmowers.
|
Market for Lawnmowers |
||
|
Price (dollars) |
Quantity of Lawnmowers Demanded |
Quantity of Lawnmowers Supplied |
|
$400 |
45 |
105 |
|
350 |
50 |
95 |
|
300 |
55 |
85 |
|
250 |
60 |
75 |
|
200 |
65 |
65 |
|
150 |
70 |
55 |
Assuming suppliers produce 75 lawnmowers per week:
1. this quantity is allocatively efficient because it will require producers to reduce the price of lawnmowers to sell all of the lawnmowers produced.
2. this quantity is allocatively efficient because the last lawnmower provides more benefits to consumers than alternative uses of the resources required to produce it.
3. this quantity is allocatively inefficient because the marginal cost of producing the last lawnmower is less than its marginal benefit to consumers.
4. this quantity is allocatively inefficient because the marginal cost of producing the last lawnmower exceeds its marginal benefit to consumers.