8
answers
0
watching
1,265
views
21 Sep 2018
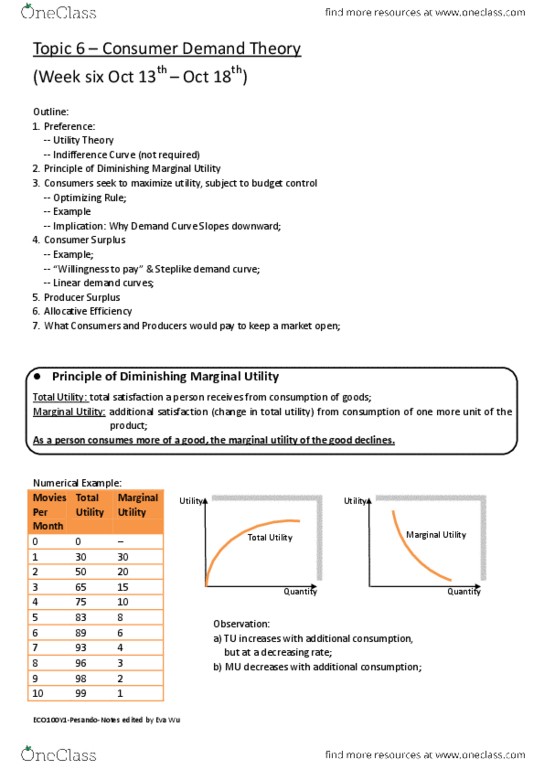
18) Refer to Figure 5-8. Suppose that a binding output quota is imposed on this market at quantity Q1. The loss in economic surplus due to the quota is equal to A) areas 5 and 6. B) areas 5, 6 and 7. C) areas 2 and 5. D) area l. E) areas 1, 2 and 3. The table below shows the quantities of toffee bars and bags of cashews that a consumer could consume over a l-week period. Toffee (bars) Cashews (bags) Units Marginal Utility Total Utility Marginal Utility Total Utility 10 10 18 10 5 23 7 5 6 27 27 TABLE 6-1
18) Refer to Figure 5-8. Suppose that a binding output quota is imposed on this market at quantity Q1. The loss in economic surplus due to the quota is equal to A) areas 5 and 6. B) areas 5, 6 and 7. C) areas 2 and 5. D) area l. E) areas 1, 2 and 3. The table below shows the quantities of toffee bars and bags of cashews that a consumer could consume over a l-week period. Toffee (bars) Cashews (bags) Units Marginal Utility Total Utility Marginal Utility Total Utility 10 10 18 10 5 23 7 5 6 27 27 TABLE 6-1

akunuru639Lv10
28 May 2023


larryrambo777Lv10
19 Mar 2023
Already have an account? Log in

Tod ThielLv2
22 Sep 2018
Already have an account? Log in