0
answers
0
watching
992
views
12 Dec 2019
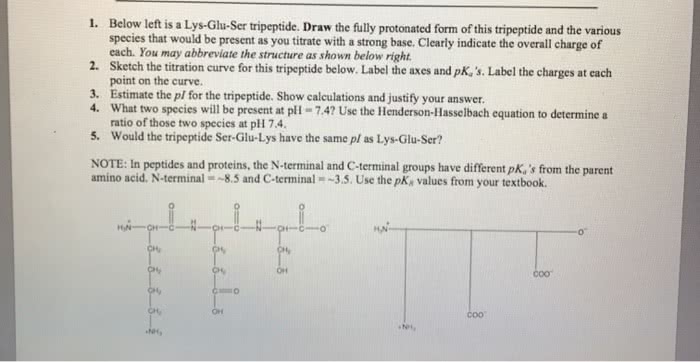
Draw the appropriate titration curve for the tripeptide Met-Lys-Val, starting at pH 1 and ending at pH 12, On the curve label the pKas and the pI. Below the titration curve, using structures, show the equilibria that occur at the buffering region(s) and the equivalence point(s).
Draw the appropriate titration curve for the tripeptide Met-Lys-Val, starting at pH 1 and ending at pH 12, On the curve label the pKas and the pI. Below the titration curve, using structures, show the equilibria that occur at the buffering region(s) and the equivalence point(s).

Related textbook solutions

Basic Chemistry
5 Edition,
Timberlake
ISBN: 9780134138046

Principles of Chemistry Molecular Approach
4th Edition,
Tro
ISBN: 9780134112831

Principles of Chemistry Molecular Approach
3rd Edition, 2014
Tro
ISBN: 9780321971944

Chemistry: Structure and Properties
2nd Edition,
Tro
ISBN: 9780134293936

Chemistry: A Molecular Approach
3rd Edition,
Tro
ISBN: 9780321809247

Chemistry: A Molecular Approach
5th Edition,
Tro
ISBN: 9780134874371

Principles of Chemistry: A Molecular Approach
4th Edition,
Tro
ISBN: 9780134895741

Chemistry: The Central Science
14th Edition, 2017
Brown
ISBN: 9780134414232