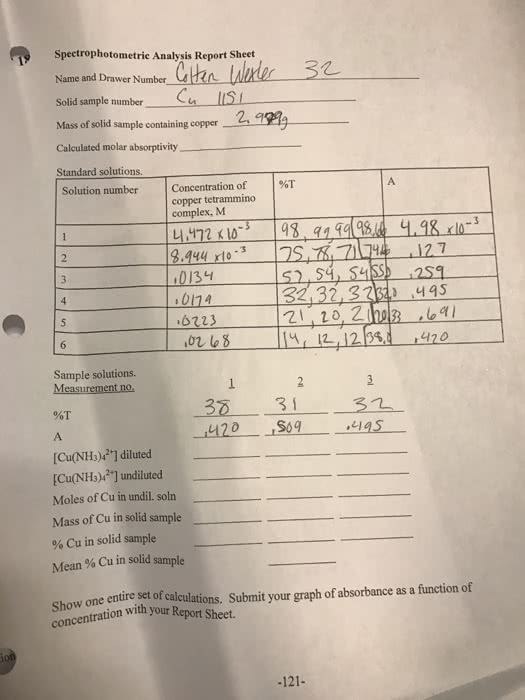
Beggining with the absorbance of your unkown brass sample show ur calculations for a) Cu+(2) (aq) concentration; b) mass of Cu in brass; c) percent Cu in brass, d) the average percent Cu in brass. Include caluclations for each trial and average when mass of brass is .725g and absorbance is .456 (nm) for first trial and for second trial mass of brass is .725g and absorbance is .525(nm)
Beggining with the absorbance of your unkown brass sample show ur calculations for a) Cu+(2) (aq) concentration; b) mass of Cu in brass; c) percent Cu in brass, d) the average percent Cu in brass. Include caluclations for each trial and average when mass of brass is .725g and absorbance is .456 (nm) for first trial and for second trial mass of brass is .725g and absorbance is .525(nm)

Related textbook solutions

Basic Chemistry

Principles of Chemistry Molecular Approach

Principles of Chemistry Molecular Approach

Chemistry: Structure and Properties

Chemistry: A Molecular Approach

Chemistry: A Molecular Approach

Principles of Chemistry: A Molecular Approach

Chemistry: The Central Science
Related questions
Just need help answering the ***** question under conclusions. here is my worksheet with information
Record your absorbance measurements for the copper (II) sulfate solution in the table below.
| Wavelength (nm) | Absorbance |
| 400 | 0.00 nm |
| 420 | 0.00 nm |
| 440 | 0.00 nm |
| 460 | 0.00 nm |
| 480 | 0.00 nm |
| 500 | 0.00 nm |
| 520 | 0.00 nm |
| 540 | 0.00 nm |
| 560 | 0.02 nm |
| 580 | 0.05 nm |
| 600 | 0.09 nm |
| 620 | 0.14 nm |
| 640 | 0.22 nm |
| 660 | 0.35 nm |
| 680 | 0.50 nm |
| 700 | 0.63 nm |
Record your absorbance measurements for the cobalt (II) chloride solution in the table below.
| Wavelength (nm) | Absorbance |
| 400 | 0.00 nm |
| 420 | 0.1 nm |
| 440 | 0.07 nm |
| 460 | 0.07 nm |
| 480 | 0.16 nm |
| 500 | 0.23 nm |
| 520 | 0.22 nm |
| 540 | 0.13 nm |
| 560 | 0.07 nm |
| 580 | 0.04 nm |
| 600 | 0.00 nm |
| 620 | 0.00 nm |
| 640 | 0.00 nm |
| 660 | 0.00 nm |
| 680 | 0.00 nm |
| 700 | 0.00 nm |
Data Analysis
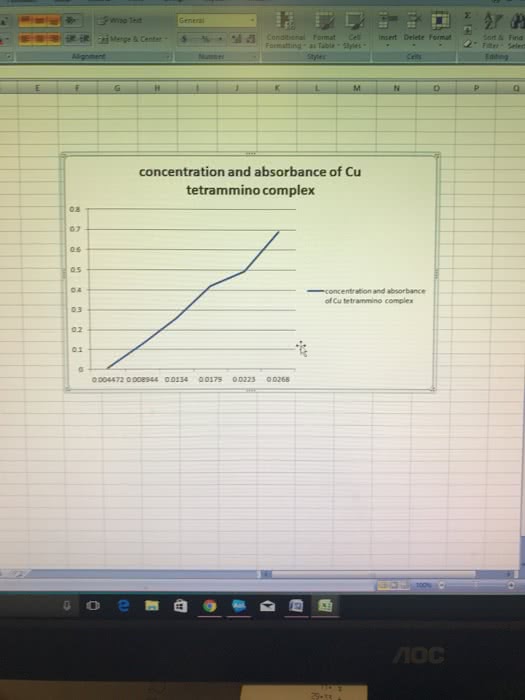
Create and save a graph of absorbance (y-axis) versus the wavelength (x-axis) for both copper (II) sulfate and cobalt (II) chloride. Click the graphing icon below to create your graph. 

Experiment 2: Measure Absorbance versus Concentration for Cu+2 Ions
Lab Results
What wavelength did you use to measure the absorbance of the copper (II) sulfate solutions?
| 700 nm |
Data Analysis
Create and save a graph of absorbance (y-axis) versus the concentration of the copper (II) sulfate solutions (x-axis). Click the graphing icon below to create your graph. 
The y-intercept of the plot of absorbance versus concentration is approximately 0. Why is this?
| It should be a straight line obtained by having a slope of = 1 and y-intercept = 0. |
Experiment 3: Determine the Cu+2 Concentration in Unknown Solutions of Copper (II) Sulfate
Lab Results
How many mL of the unknown solutions did you use for your absorbance measurements?
| 10 mL |
Data Analysis
Determine the copper (II) sulfate concentrations in your two unknown samples from the calibration plot.
| wavelength used: 700 nm absorbance unknown: a. 0.08 b. 0.12 |
Conclusions
*******Were the unknown solutions more or less concentrated than the copper (II) sulfate solution used in experiment 1?
Given the data in the table below, what is the concentration of the unknown solution? Both solutions contain the same substance.
| standard solution concentration | 1.25 M |
| standard solution absorbance | 0.75 |
| unknown solution absorbance | 0.38 |
| 0.63 M is the concentration of the unknown solution. |