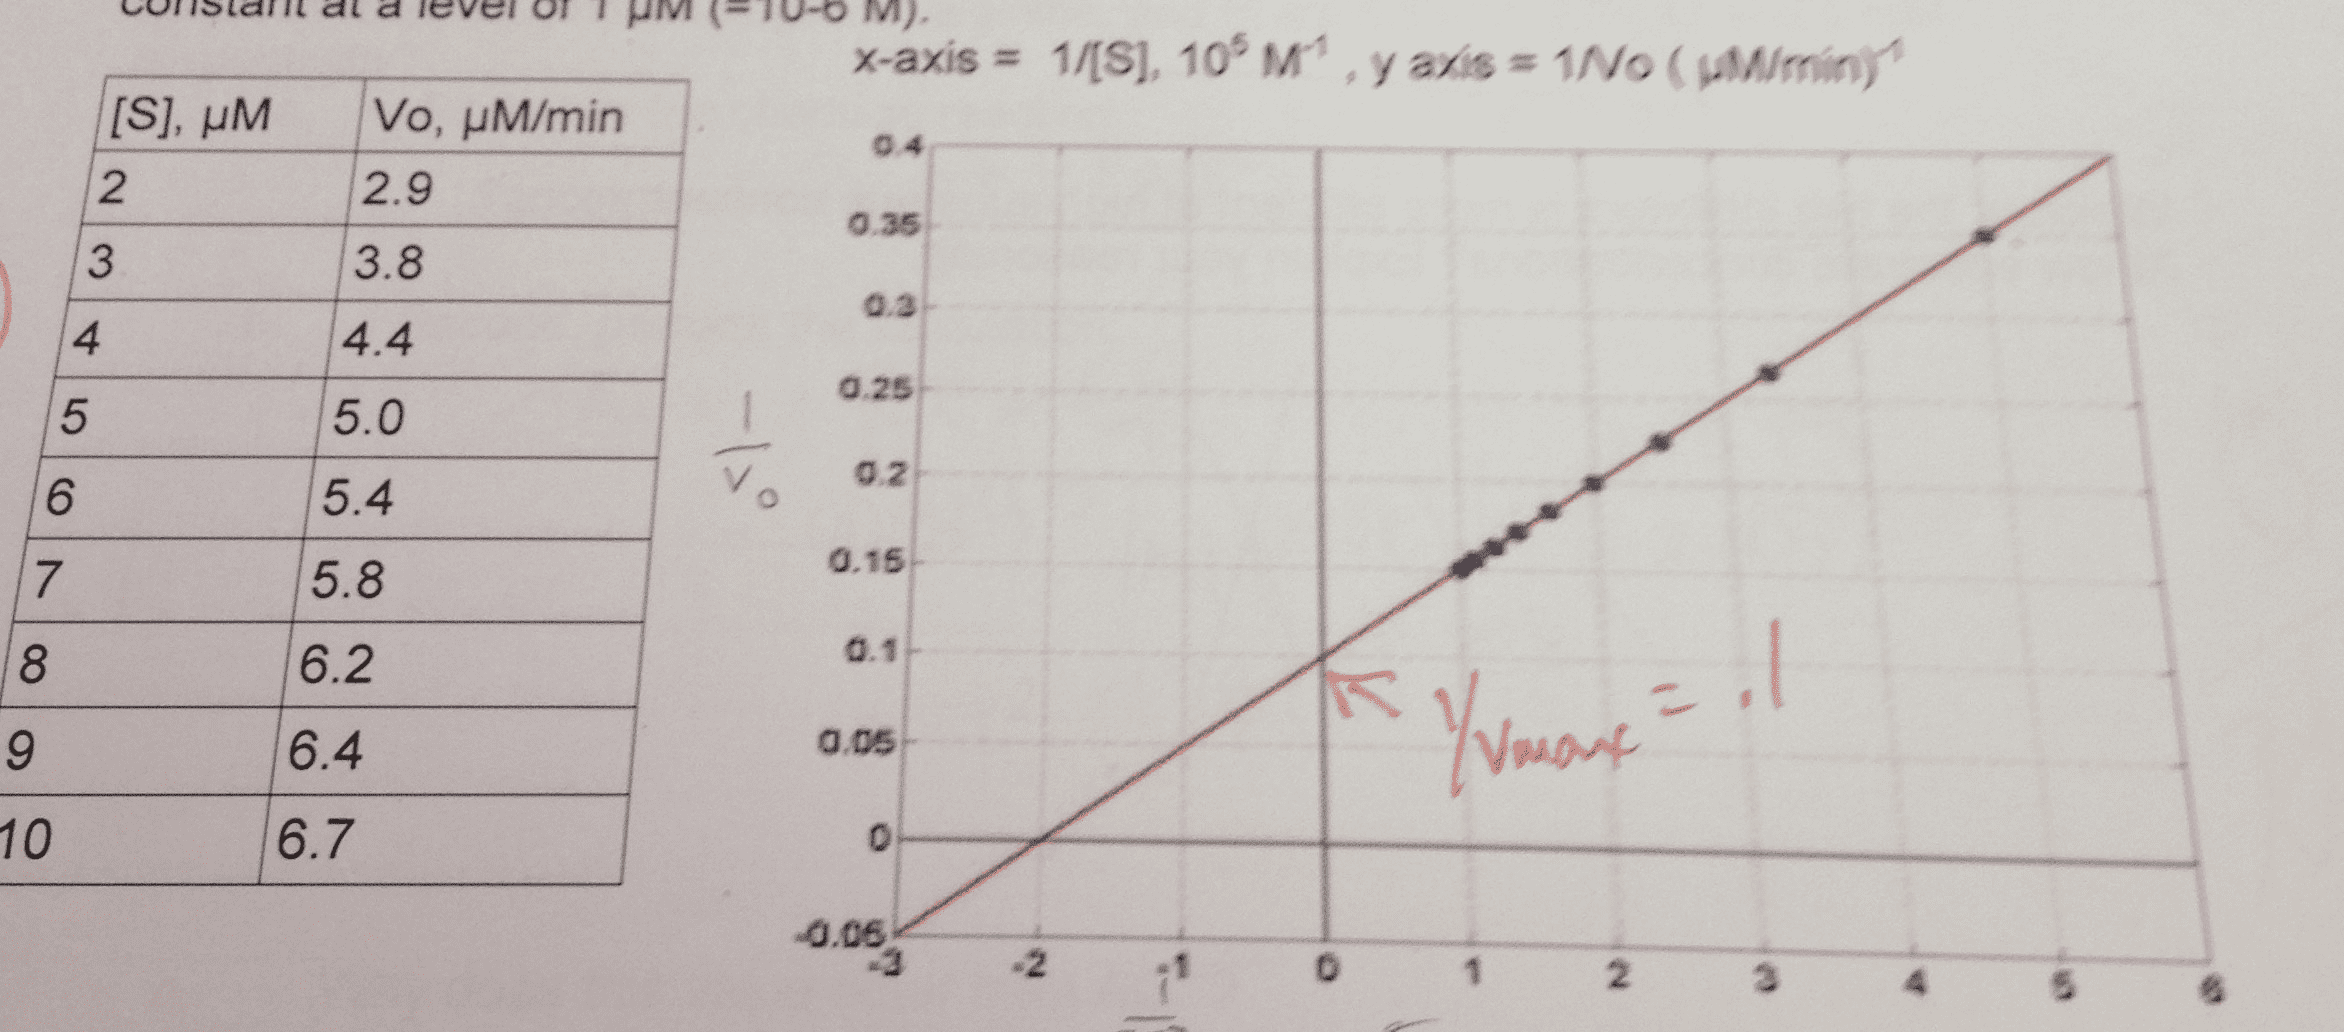
You measure the kinetics of an enzyme E as a function ofsubstrate concentration first without an inhibitor (see Table) andplot the data using the double-reciprocal (Lineweaver-Burk) plot(figure below). The enzyme concentration is maintained constant ata level of 1 �M (=10-6 M)
a. from these data, calculate Vmax and Km. Do not estimate. Showcalculation.
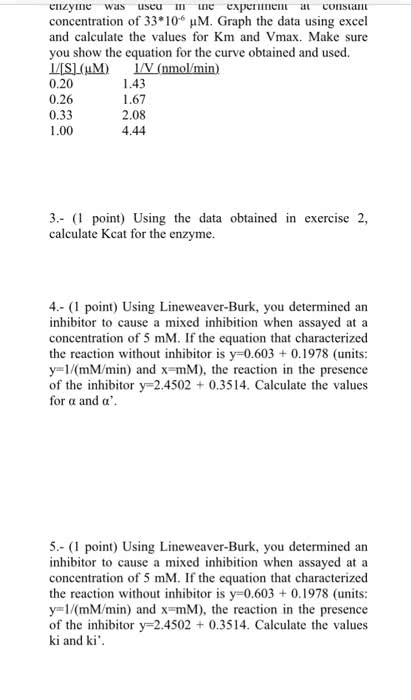
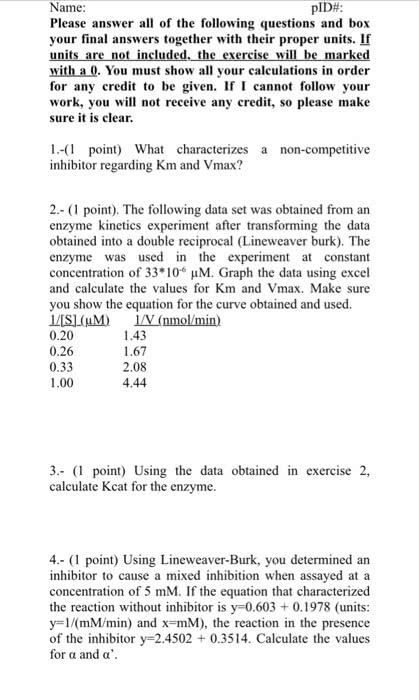
b. now you study enzyme inhibition by measuring enzyme kineticsin the presence of 10�M of inhibitor A or inhibitor B (separately).The lineweaver-Burk plots in the presence of these inhibitors areindicated by �+A� or �+B� in the Figure below
x-axis = 1/[S], 105 M-1
Y-axis = 1/Vo (�M/min)-1
From these data determine the type of inhibition for:
+A .
+B .
Draw a scheme for the mechanism for the inhibition under +A and+B:
Which of the two inhibitors is more efficient at high substrateconcentrations? At low substrate concentrations? Explain yourreasoning.
You measure the kinetics of an enzyme E as a function of substrate concentration first without an inhibitor (see Table) and plot the data using the double-reciprocal (Lineweaver-Burk) plot (figure below). The enzyme concentration is maintained constant at a level of 1 �½M (=10-6 M) x-axis = 1/[S], 105 M-1 Y-axis = 1/Vo (�½M/min)-1 From these data determine the type of inhibition for: +A. +B . Draw a scheme for the mechanism for the inhibition under +A and +B: Which of the two inhibitors is more efficient at high substrate concentrations? At low substrate concentrations? Explain your reasoning. a. from these data, calculate Vmax and Km. Do not estimate. Show calculation. b. now you study enzyme inhibition by measuring enzyme kinetics in the presence of 10�½M of inhibitor A or inhibitor B (separately). The lineweaver-Burk plots in the presence of these inhibitors are indicated by �½+A�½ or �½+B�½ in the Figure below