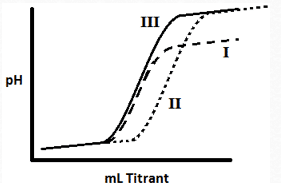
The graph below is a titration curve of three differentsolutions. Solution I is titrated with a base of a lower pH. Rankthe solutions in terms of the strength of the acid in thesolution.
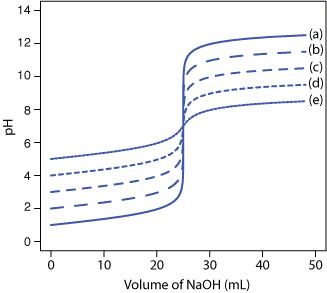
Apparantly, the correct answer is "there is no difference amongthe strength of the acids," however I'm not entirely sure why. Theexplanation states that graph II has a higher concentration of acidthan graph III, but why would this shift the titration curve to theright? Shouldn't the curve just become less compressed at higherconcentrations as shown in the following figure?
Or would this only be the case if the question stated explicitlythat only the identity of the analyte was the same in all 3solutsions? In other words, does this mean solution II must be a ofa different concentration as well as a different identity? Whatsignificance is it that solutions II and III still have the sameequivalence point? Also, I don't understand why a titrant of lowerpH (i.e. in the titration of solution I) would decrease theequivalence point. Wouldn't you then need more titrant toneutralize the analyte if the pH of the titrant were lower? Cansomeone please thoroughly explain? Thank you!