1
answer
1
watching
954
views
11 Nov 2019
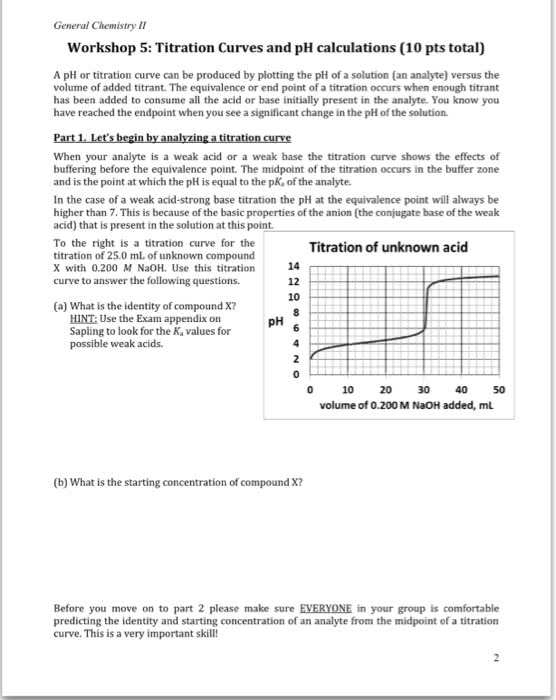
General Chemistry I Workshop 5: Titration Curves and pH calculations (10 pts total) A pH or titration curve can be produced by plotting the pH of a solution (an analyte) versus the volume of added titrant. The equivalence or end point of a titration occurs when enough titrant has been added to consume all the acid or base initially present in the analyte. You know you have reached the endpoint when you see a significant change in the pH of the solution. When your analyte is a weak acid or a weak base the titration curve shows the effects of buffering before the equivalence point. The midpoint of the titration occurs in the buffer zone and is the point at which the pH is equal to the pK, of the analyte. In the case of a weak acid-strong base titration the pH at the equivalence point wil always be higher than 7.This is because of the basic properties of the anion (the conjugate base of the weak acid) that is present in the solution at this point To the right is a titration curve for the titration of 25.0 mL of unknown compound X with 0.200 M NaOH. Use this titration curve to answer the following questions. Titration of unknown acid 14 12 10 (a) What is the identity of compound X? HINT: Use the Exam appendix on Sapling to look for the Ka values for possible weak acids. pH 10 20 30 40 50 volume of 0.200 M NaOH added, ml (b) What is the starting concentration of compound X? Before you move on to part 2 please make sure EVERYONE in your group is comfortable predicting the identity and starting concentration of an analyte from the midpoint of a titration curve. This is a very important skill!
Trinidad TremblayLv2
22 Jun 2019