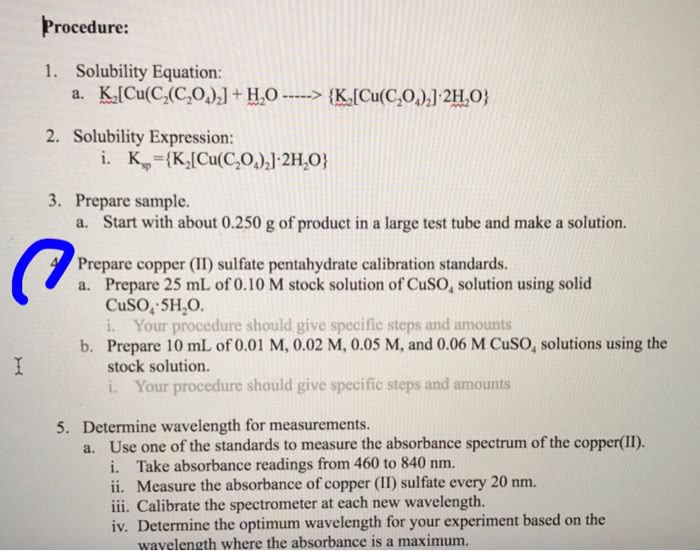
Solubility Equation: a. K_2[Cu(C_2(C_2O_4)_2] + H_2O rightarrow {K_2[Cu(C_2O_4)_2] middot 2 H_2 O} Solubility Expression i. K_sp = {K_2[Cu(C_2O_4)_2] middot 2H_2O} Prepare sample. a. Start with about 0.250 g of product in a large test tube and make a solution. Prepare copper (II) sulfate pentahydrate calibration standards. a. Prepare 25 mL of 0.10 M stock solution of CuSO_4 solution using solid CuSO_4 middot 5 H_2O. i. Your procedure should give specific steps and amounts b. Prepare 10 mL of 0.01 M, 0.02 M, 0.05 M, and 0.06 M CuSO_4 solutions using the stock solution. i. Your procedure should give specific steps and amounts Determine wavelength for measurements. a. Use one of the standards to measure the absorbance spectrum of the copper(II). i. Take absorbance readings from 460 to 840 nm. ii. Measure the absorbance of copper (II) sulfate every 20 nm. iii. Calibrate the spectrometer at each new wavelength. iv. Determine the optimum wavelength for your experiment based on the wavelength where the absorbance is a maximum.
Record your absorbance measurements for the cobalt (II) chloride solution in the table below.
Wavelength (nm)
Absorbance
400
0.00 nm
420
0.1 nm
440
0.07 nm
460
0.07 nm
480
0.16 nm
500
0.23 nm
520
0.22 nm
540
0.13 nm
560
0.07 nm
580
0.04 nm
600
0.00 nm
620
0.00 nm
640
0.00 nm
660
0.00 nm
680
0.00 nm
700
0.00 nm
Data Analysis
Create and save a graph of absorbance (y-axis) versus the wavelength (x-axis) for both copper (II) sulfate and cobalt (II) chloride. Click the graphing icon below to create your graph.
Experiment 2: Measure Absorbance versus Concentration for Cu+2 Ions
Lab Results
What wavelength did you use to measure the absorbance of the copper (II) sulfate solutions?
700 nm
Data Analysis
Create and save a graph of absorbance (y-axis) versus the concentration of the copper (II) sulfate solutions (x-axis). Click the graphing icon below to create your graph. Click the box underneath the graph to show the trendline. It will automatically calculate your slope and intercept.
The y-intercept of the plot of absorbance versus concentration is approximately 0. Why is this?
It should be a straight line obtained by having a slope of = 1 and y-intercept = 0.
Experiment 3: Determine the Cu+2 Concentration in Unknown Solutions of Copper (II) Sulfate
Lab Results
How many mL of the unknown solutions did you use for your absorbance measurements?
10 mL
Data Analysis
Determine the copper (II) sulfate concentrations in your two unknown samples from the calibration plot.
wavelength used: 700 nm
absorbance unknown: a. 0.08 b. 0.12
Conclusions
*******Were the unknown solutions more or less concentrated than the copper (II) sulfate solution used in experiment 1?
Given the data in the table below, what is the concentration of the unknown solution? Both solutions contain the same substance.
standard solution concentration
1.25 M
standard solution absorbance
0.75
unknown solution absorbance
0.38
0.63 M is the concentration of the unknown solution.