QMB-210 Lecture 12: Frequency distribution (relative, cumulative)/ Histogram/ Central tendency/ Categorical data/ Weighted means/ Outliers/ Shapes of distribution

20 Feb 2017
School
Department
Course
Professor
Document Summary
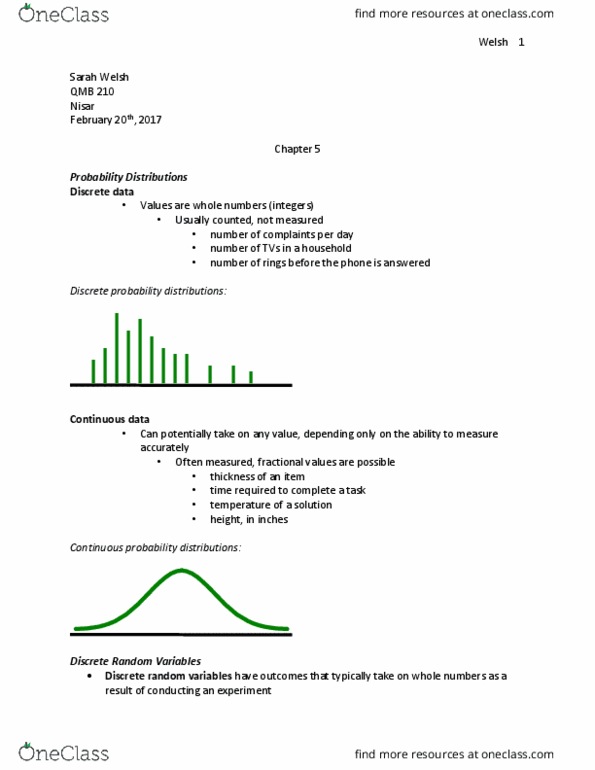
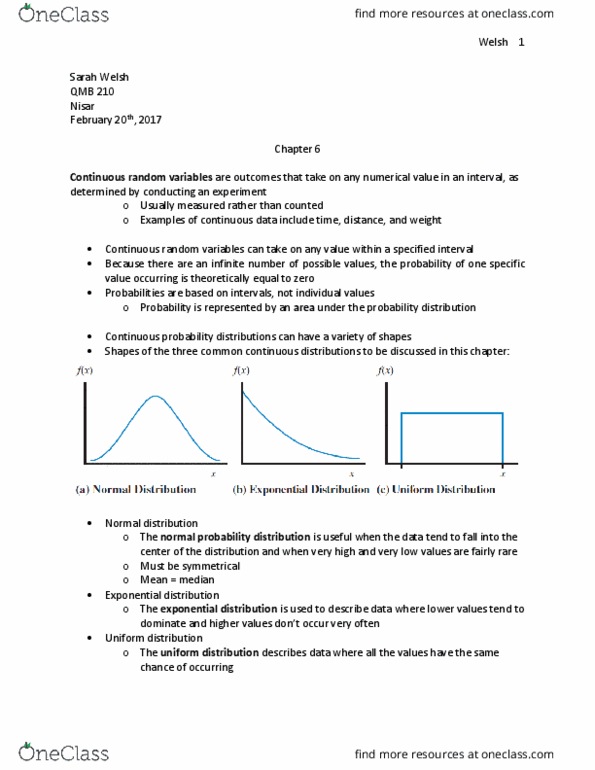
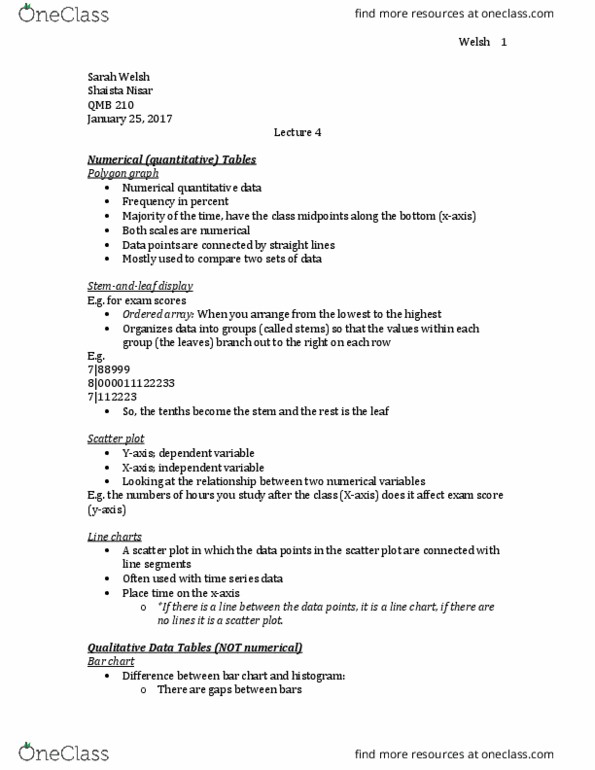
A frequency distribution is a table that shows the number of data observations that fall into specific intervals. Class: each row in the frequency distribution table. Discrete data: values based on observations that can be counted and are typically represented by whole numbers. Continuous data: valued that can take on any real numbers, including numbers that contain decimal points. Relative frequency distribution displays the proportion of observations of each class relative to the total number of observations. Cumulative relative frequency distribution totals the proportion of observations that are less than or equal to the class at which you are looking. Histogram: a graph showing the number of observations in each class of a frequency distribution. Both axis on a histogram are quantitative. Central tendency is a single value used to describe the center point of a data set. Mean: adding up all the data set then dividing them by the total number.