QMB-210 Lecture Notes - Lecture 4: Pie Chart, Pareto Chart, Bar Chart

25 Jan 2017
School
Department
Course
Professor

Welsh
1
Sarah Welsh
Shaista Nisar
QMB 210
January 25, 2017
Lecture 4
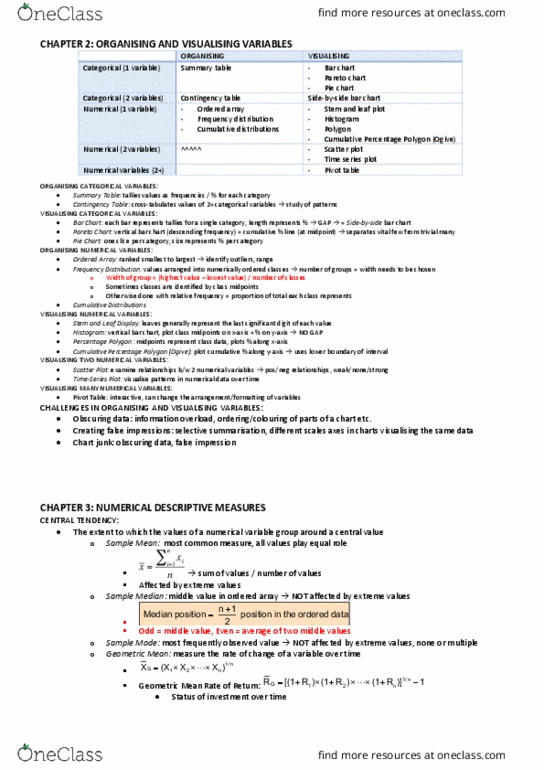
Numerical (quantitative) Tables
Polygon graph
• Numerical quantitative data
• Frequency in percent
• Majority of the time, have the class midpoints along the bottom (x-axis)
• Both scales are numerical
• Data points are connected by straight lines
• Mostly used to compare two sets of data
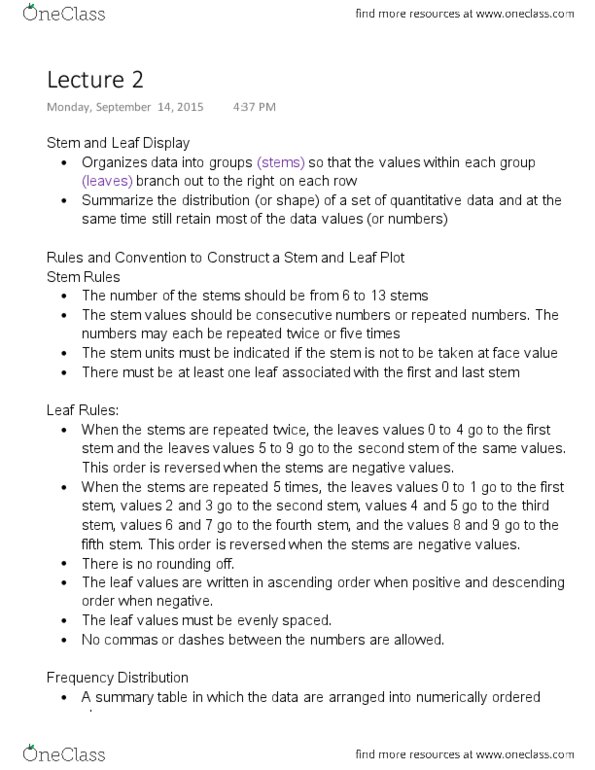
Stem-and-leaf display
E.g. for exam scores
• Ordered array: When you arrange from the lowest to the highest
• Organizes data into groups (called stems) so that the values within each
group (the leaves) branch out to the right on each row
E.g.
7|88999
8|000011122233
7|112223
• So, the tenths become the stem and the rest is the leaf
Scatter plot
• Y-axis; dependent variable
• X-axis; independent variable
• Looking at the relationship between two numerical variables
E.g. the numbers of hours you study after the class (X-axis) does it affect exam score
(y-axis)
Line charts
• A scatter plot in which the data points in the scatter plot are connected with
line segments
• Often used with time series data
• Place time on the x-axis
o *If there is a line between the data points, it is a line chart, if there are
no lines it is a scatter plot.
Qualitative Data Tables (NOT numerical)
Bar chart
• Difference between bar chart and histogram:
o There are gaps between bars
find more resources at oneclass.com
find more resources at oneclass.com
Document Summary
E. g. for exam scores: ordered array: when you arrange from the lowest to the highest, organizes data into groups (called stems) so that the values within each group (the leaves) branch out to the right on each row. 7|112223: so, the tenths become the stem and the rest is the leaf. Scatter plot: y-axis; dependent variable, x-axis; independent variable, looking at the relationship between two numerical variables. E. g. the numbers of hours you study after the class (x-axis) does it affect exam score (y-axis) Bar chart: difference between bar chart and histogram, there are gaps between bars. Welsh 2: they are categorical, x-axis does not have a numerical value but does represent something, Y-axis is numerical (for a vertical bar chart: can display multiple series of data with cluster bar charts or stacked bar charts, visualizes a categorical variable, *if one scale is categorical it is a bar chart.