STATS 250 Lecture Notes - Lecture 1: Pie Chart, Unimodality, Sleep Deprivation
STATS 250 verified notes
1/7View all
Document Summary
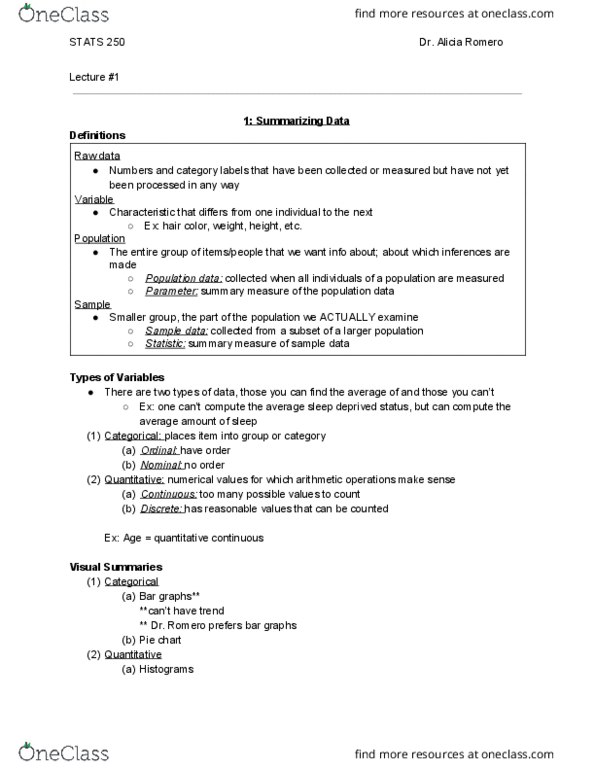
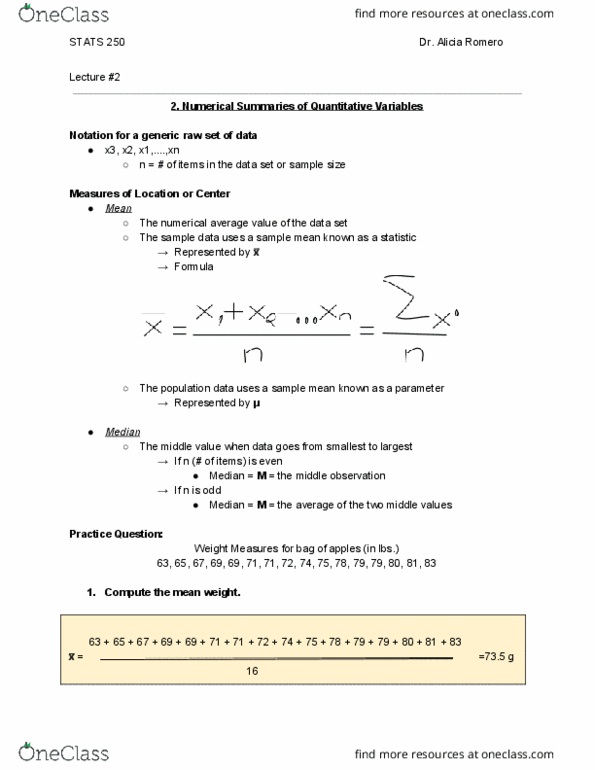
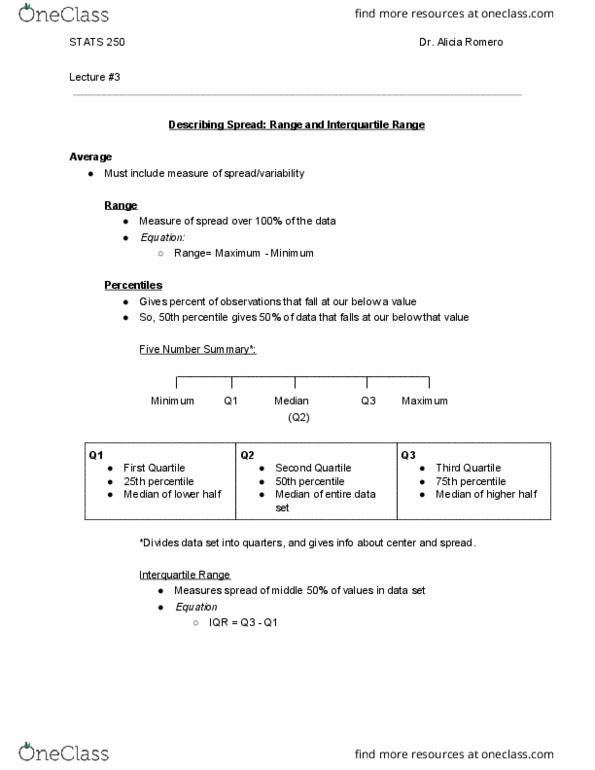
Numbers and category labels that have been collected or measured but have not yet been processed in any way. Characteristic that differs from one individual to the next. The entire group of items/people that we want info about; about which inferences are. Population data: collected when all individuals of a population are measured. Parameter: summary measure of the population data. Smaller group, the part of the population we actually examine. Sample data: collected from a subset of a larger population. There are two types of data, those you can find the average of and those you can"t. ** dr. romero prefers bar graphs (b) pie chart (2) quantitative (a) histograms. Ex: (2, 4], this represents 2 to 4, not including 2, but including 4. Data point that is not consistent with the bulk of the data. Approximation of the middle value or balancing point. Range (overall) and where most of the observations are. Don"t put spaces in between histogram bars.


