STAT 1000Q Lecture 3: Week 2 Cornell-style Notes [TYPED]


STAT 1000Q verified notes
3/30View all

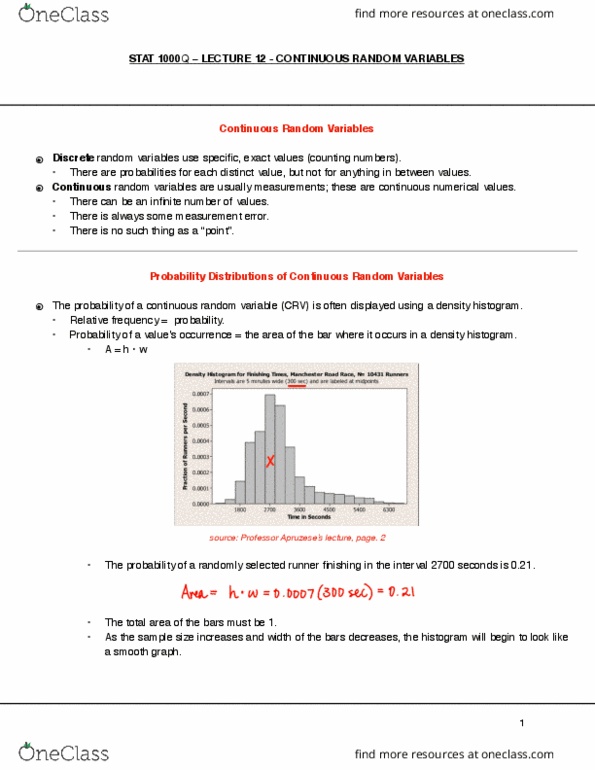
Document Summary
Stat 1000q lecture 3 - density/distribution graphs, subscripted. Variables & summation notation, the three m"s, quartiles and percentiles. Last lecture, we left off at the different types of histograms that exist. Lecture 3 notes will continue with density histograms and lead. Density histograms: computation of bar height: Interval = [a, b: width = (b - a, height = h, relative frequency = rf. Rf = bar area = h(b - a: resulting equation: This is a smooth graph that models the tops of the bars in a density histogram. Orientations of graphs source: professor apruzese"s lecture, pg. Density (distribution) graph source: professor apruzese"s lecture, pg. Sample mean = x , or x bar . There is one value exactly in the middle. The median is the average of the two values. To distinguish between different values of a single variable, we give the variable a subscript.