STATS 10 Lecture 2: Stats 10 Lecture 2

Document Summary
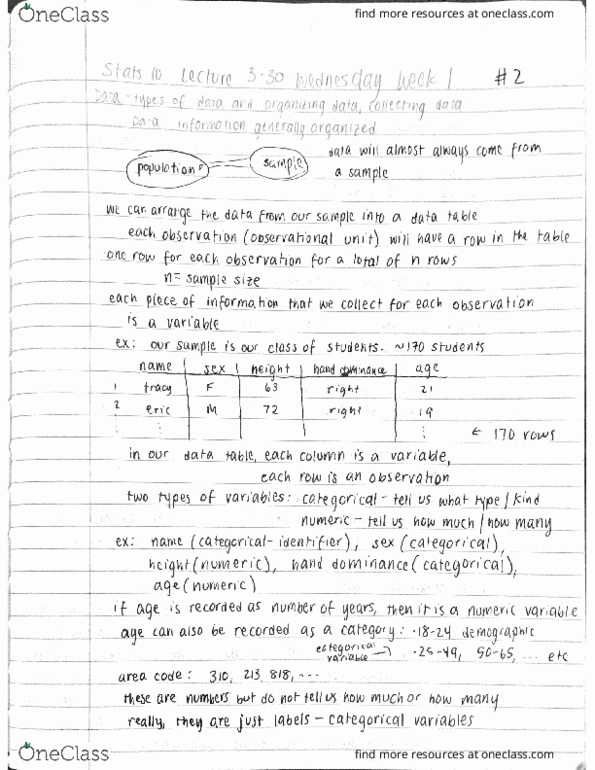
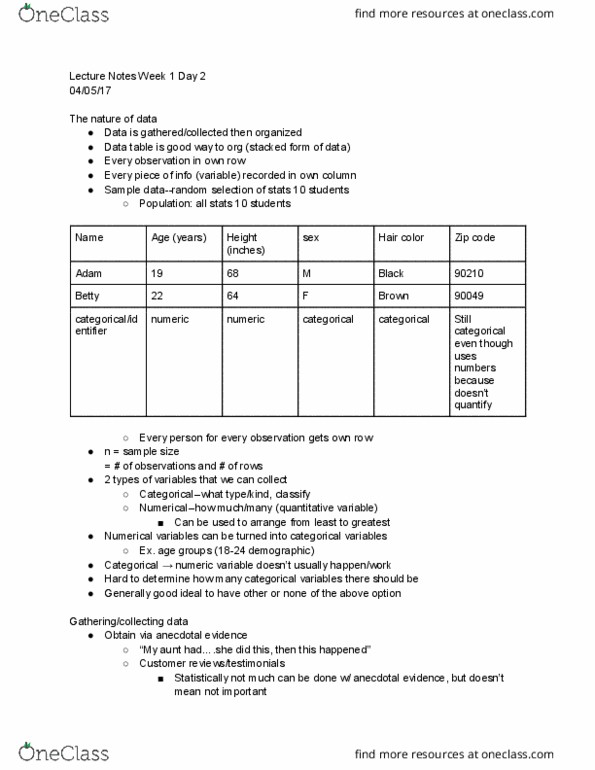
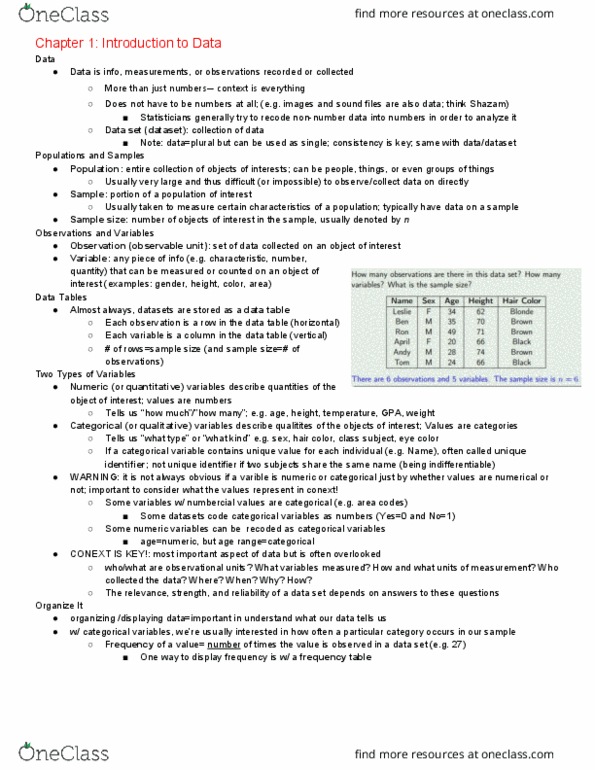
Gather data -> organize collected information: most common way in statistics to do so: data table. In a data table, every observation is in a row: every row represents one observation, each column contains a variable, every piece of information we gather for each observation is put to a column (variables) N = sample size = number of observations = number of rows in table. Categorical: tell us what type or what kind. Numeric: tell us how much or how many. Age: under 18 = minor, 18 or above = adult. Choosing the number of values that a categorical variable can take is complicated and sometimes controversial. Sample of data = a group of 40 students. Anecdotal evidence: stories, personal experiences, (cid:272)usto(cid:373)er re(cid:448)ie(cid:449)s, (cid:862)(cid:373)y aunt did this and it (cid:272)ured her (cid:272)a(cid:374)(cid:272)er(cid:863, ca(cid:374)"t do (cid:373)u(cid:272)h (cid:449)ith a(cid:374)e(cid:272)dotal e(cid:448)ide(cid:374)(cid:272)e fro(cid:373) a statisti(cid:272)al sta(cid:374)dpoi(cid:374)t. Observational studies: we observe our subjects.