MCD BIO 165A Lecture Notes - Lecture 7: Colocalization, Probability Distribution, Cell Membrane

20 Apr 2017
School
Course
Professor
Document Summary
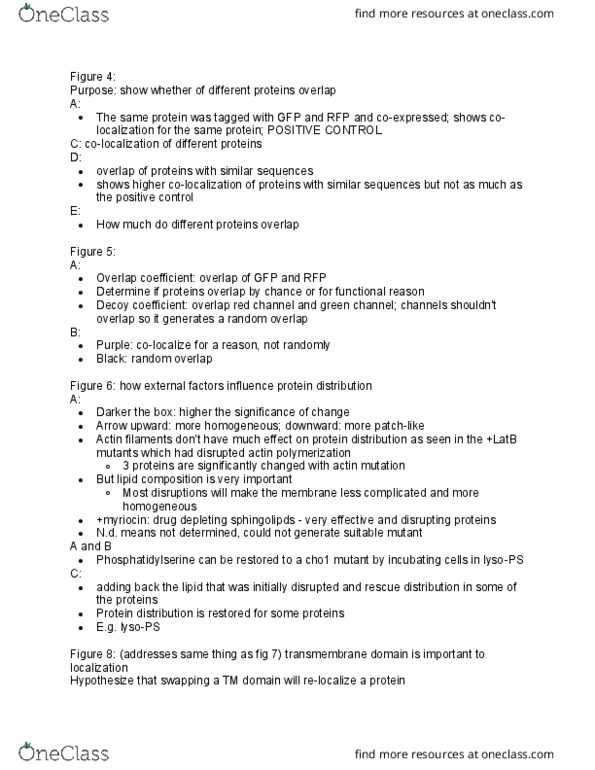
Figure 2a shows how are these proteins are distributed, which ranges from patch-like to network-like patterns. Figure 2b shows the line intensity graphs used to characterize the different distributions. In the graphs, the intensity/peaks only appear where the white dots in 2a occur along the colored lines drawn in the frames. In a patch-like area, these peaks are very sharp but in a network-like distribution the graph is fairly continuous with some sharp peaks: what does the data suggest about the distributions of bio5 versus. Bio5"s distribution consists of three sharp peaks that are far apart from each other with area of no/low intensity found between each peak while hxt3"s distribution is a smooth, continuous graph with peaks interspersed within the never-zero intensity spectra. This suggests that bio5 has a more patch-like distribution while bio5 has a more network-like distribution. The high intensity peaks found in bio5 signify more compact patches spread out from other patches.