BIS 2B Lecture Notes - Lecture 6: Life Table, Survivorship Curve, Demographic Transition

2 Nov 2018
School
Department
Course
Professor
BIS 2B verified notes
6/31View all
Document Summary
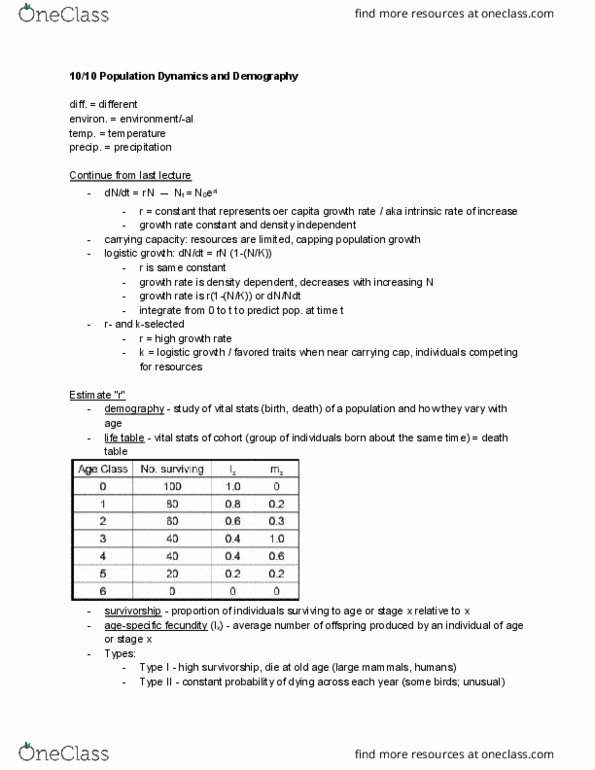
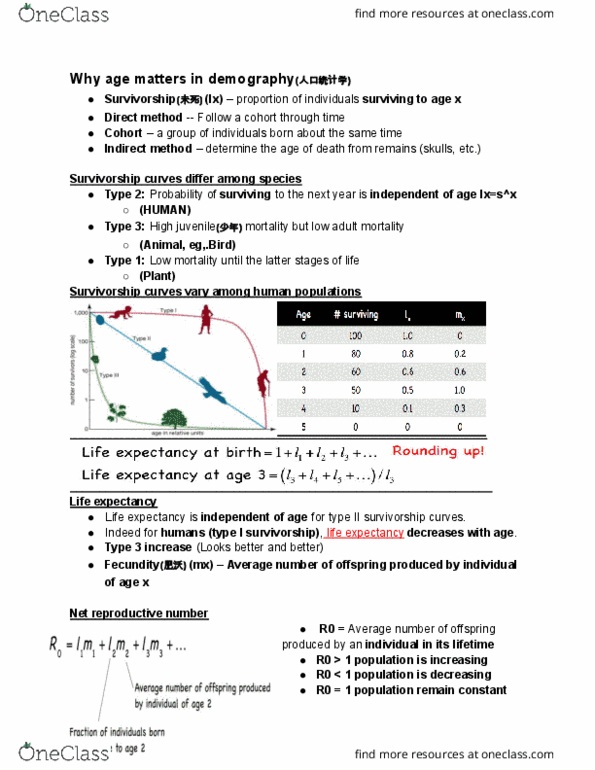
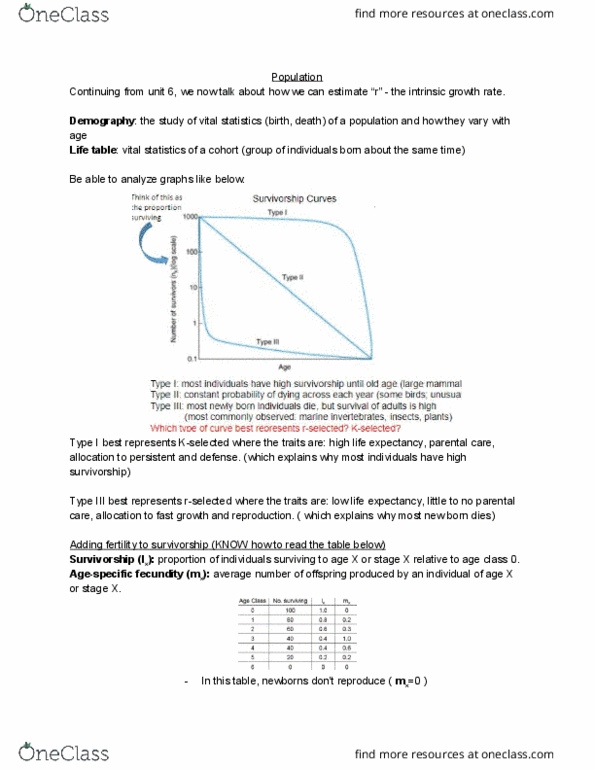
: the study of vital statistics (birth, death) of a population and how they vary with. Continuing from unit 6, we now talk about how we can estimate r - the intrinsic growth rate. : vital statistics of a cohort (group of individuals born about the same time) Type i best represents k-selected where the traits are: high life expectancy, parental care, allocation to persistent and defense. (which explains why most individuals have high survivorship) Type iii best represents r-selected where the traits are: low life expectancy, little to no parental care, allocation to fast growth and reproduction. ( which explains why most new born dies) Adding fertility to survivorship (know how to read the table below) Proportion of individuals surviving to age x or stage x relative to age class 0. Average number of offspring produced by an individual of age x. In this table, newborns don"t reproduce ( m .