STAT 095 Lecture Notes - Lecture 2: Frequency Distribution, Histogram, Unimodality

Document Summary
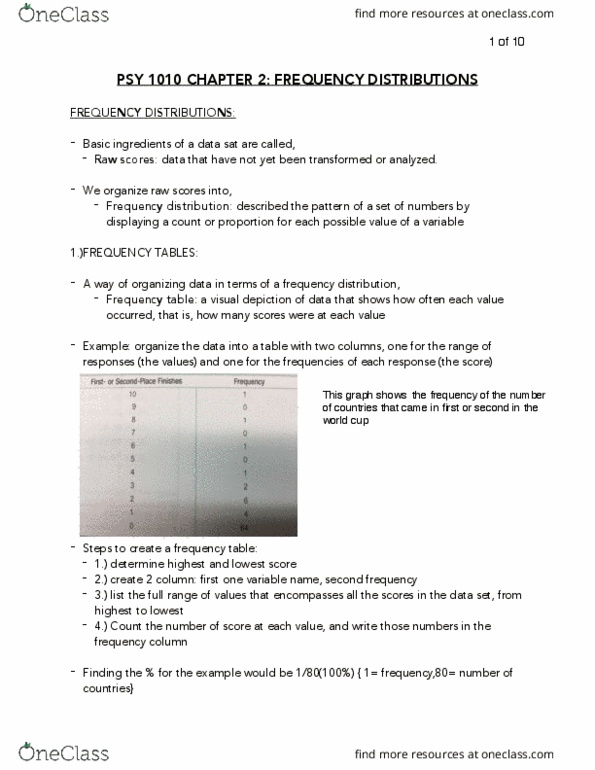
Researchers are most interested in the relations between 2 or more variables. Example: the effect of a tv show"s pacing (independent variable) on children"s learning (dependent variable) The basic ingredients of a data set = raw scores. Raw scores: data that have not yet been transformed or analyzed. Raw scores are organized into a frequency distribution. Example: a frequency distribution can display the pattern of the scores -the pacing. Frequency table: visual depiction of data that shows how often each value has occurred. Once organized into a frequency table, the data can then be displayed as a grouped (how many scores were at each value) frequency table, histogram, or frequency polygon. How to create a frequency table (with world cup success example: determine the range of raw scores. For each country, we can count how many 1st or 2nd place finishes these countries have had: 4,8,1,2,1,2,2,6,1,2,1,2,3,3,2,10. In addition, 64 countries had 0 1st or 2nd places finishes.